Tutorial
How to compare investments well, and how EasyCompare helps you do it
Most investing mistakes are not failures of arithmetic but failures of comparison: a fund is admired without asking what else was available, a stock is judged on the one period that flatters it, or a high return is celebrated without noticing the risk that was taken to earn it. This tutorial sets out a small number of principles for comparing investments fairly, explains the market ideas behind each of them, and shows how to put each one into practice in EasyCompare.
The figures quoted in the text are total returns, with dividends reinvested, measured to the market close on October 21, 2026, and most of the screenshots were taken with the same end date. A few screenshots show features that always run up to the present moment, namely the rank heatmap, the multi-period matchup, the holdings view and the intraday chart; these were captured on October 22, 2026, so their figures differ slightly from those in the text. The links marked Try it open the same comparison in EasyCompare with today's prices.
The habit of comparison
1Every investment decision is a comparison
A question such as "Is Microsoft a good investment?" cannot be answered on its own terms, because the answer depends entirely on what the money would otherwise be doing. A return of eight percent a year is splendid if the alternative was a savings account and disappointing if an ordinary index fund returned twelve. Economists call the return you give up by choosing one option over another its opportunity cost, and every purchase, sale or decision to hold carries one, whether or not it is ever examined.
The practical consequence is that the useful question is always comparative: is this investment better than the alternatives I could reasonably hold instead, over the periods that matter to me, and at a level of risk I could tolerate? EasyCompare is built around that question. It places many investments on a common footing, measures them over the same windows, and ranks them on return and on risk, so that you judge each one against its real alternatives rather than in isolation.
Throughout this tutorial we shall follow a single investor. She already owns an S&P 500 index fund (SPY) and is considering whether to add, or switch to, one of five alternatives: the Nasdaq-100 fund QQQ, the dividend fund SCHD, the total-market fund VTI, and two individual companies, Microsoft (MSFT) and JPMorgan Chase (JPM). Her situation is common, and it will turn out to be more interesting than it looks.
Eight principles of comparison
The rest of the tutorial develops eight principles, each of which corresponds to a part of the app.
- An investment can only be judged against the alternatives you could have chosen instead, so the first step is always to name those alternatives. This section
- You should compare against the whole field rather than against the one or two names you already like, because a narrow comparison quietly confirms what you already believe. Section 2
- Every candidate must start from the same line and be measured in the same way, with dividends included, or the comparison is not fair. Section 3
- The window you choose shapes the answer, so it should be chosen deliberately and tested against periods when markets were under strain. Section 4
- A result over a single period is an anecdote, whereas consistency across many periods is evidence. Sections 5 and 6
- The ride matters as much as the destination, because a return you could not have held on through is not a return you would have earned. Sections 7 to 9
- You should know what you actually own, since several holdings that look different can turn out to be the same bet. Section 10
- The metrics are most useful in combination, and no single number should settle a decision on its own. Section 11
Setting up a comparison
Everything begins in the settings panel at the top of the app. The numbered markers in the screenshot below correspond to the list that follows it.
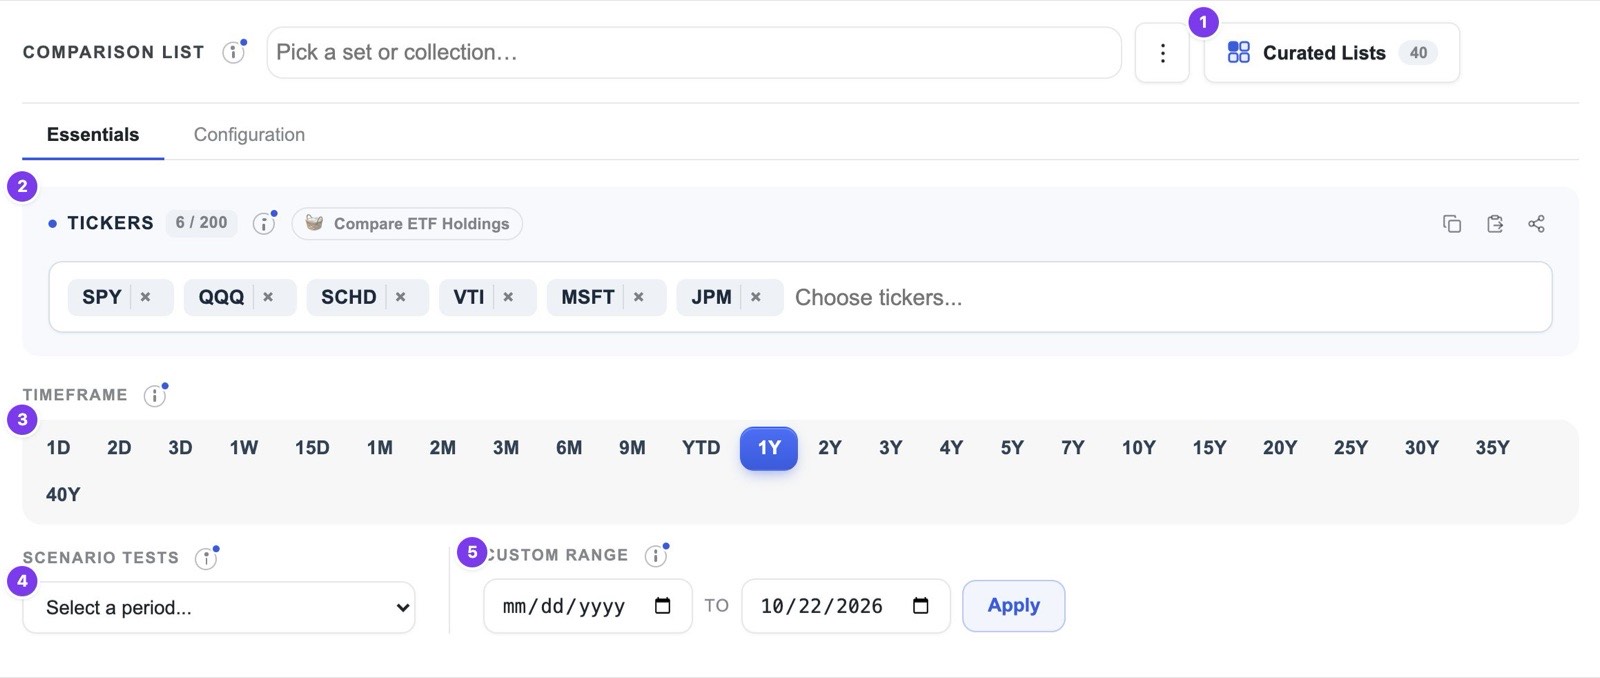
- 1Comparison lists and curated lists. Each comparison you build is saved as a list, and the Curated Lists button opens forty ready-made lists, from the major asset classes to the largest companies in the S&P 500.
- 2Tickers. You may type any US stock, ETF or mutual fund, and you may mix the three freely. A list holds up to 15 tickers on the free plan and up to 200 on Pro.
- 3Timeframe. The buttons select a period ending today, from one day to forty years. The free plan reaches back five years and Pro reaches back forty.
- 4Scenario tests. This menu replaces the period with a historical episode such as the 2022 bear market or the COVID crash, which section 4 discusses at length.
- 5Custom range. Any start and end date may be entered here, which is how the charts in this tutorial were fixed to the close of October 21, 2026.
Comparing fairly
2Compare the whole field, not merely a pair
When people compare investments informally, they usually compare two names they already know. The difficulty with this habit is that the pair was chosen before any evidence was examined, so the comparison can only tell you which of your existing favourites did better; it cannot tell you whether either of them was a good choice among everything that was available. Psychologists call the tendency to seek out evidence that confirms an existing view confirmation bias, and narrow comparisons are one of its most common forms in investing.
Consider the fifty largest companies in the S&P 500 over the year to October 21, 2026. An investor comparing Apple with Microsoft would conclude that Apple, which returned 31.4% against Microsoft's 3.8%, was the clear winner. Set against the whole group, however, Apple ranked only thirteenth of the forty-eight companies with data, and Microsoft twenty-ninth. The leaders were names few people would have paired: AMD returned 132.2%, Merck 76.1%, Exxon Mobil 62.6% and Texas Instruments 61.5%. Only twenty of the forty-eight beat SPY's 16.4%, and the median company returned about 10.7%, which is a useful reminder that owning the index was a demanding standard to beat even among its largest members.
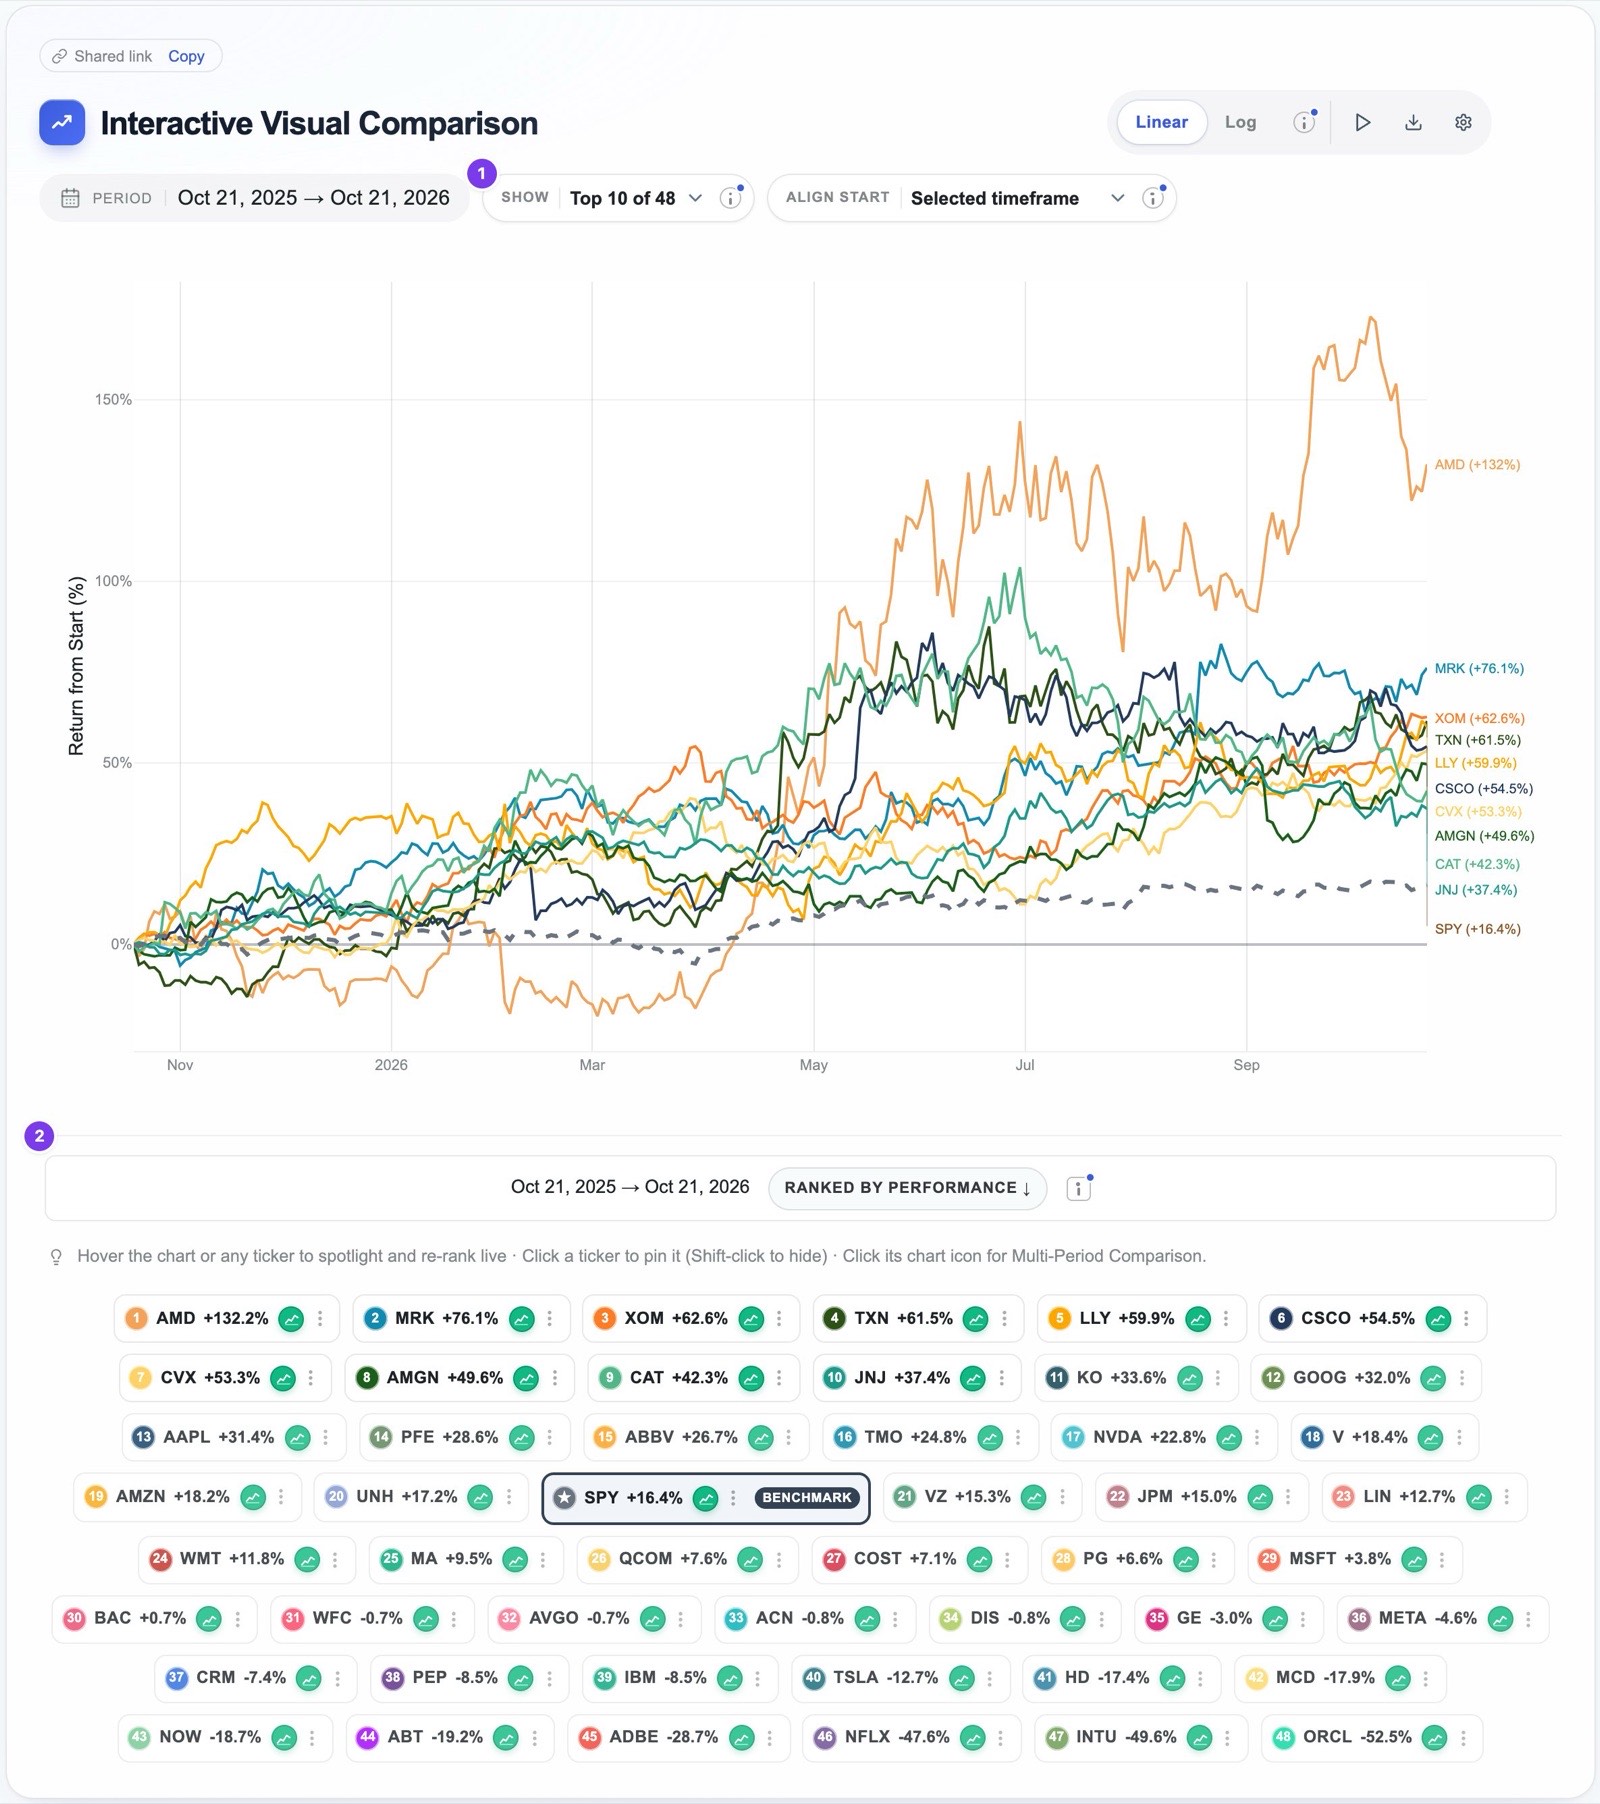
Comparing many investments at once raises an obvious visual problem, since fifty lines on one chart become an unreadable tangle. EasyCompare addresses this in three ways. When a list reaches twenty tickers, a Show control appears above the chart, which plots only the top ten, fifteen or twenty performers while the legend and the rankings table continue to rank every ticker. Hovering over any line or legend chip brings that investment to the front and dims the others, clicking a chip pins it, and holding Shift while clicking hides it. Together these allow you to survey the whole field and then examine any member of it closely.
To reproduce this view, open Curated Lists, choose S&P 500 Top 50, and select the one-year timeframe. One caution belongs here, and it is discussed further in section 15: a list of today's largest companies is, by construction, a list of past winners, so it flatters the companies in it.
3Start everyone from the same line, and watch how the leaders change
A common starting line
Share prices on their own say nothing about performance. A stock priced at twenty dollars and one priced at five hundred cannot sensibly share an axis, and a stock that has fallen from a high price may still trade above one that has doubled. EasyCompare therefore rebases every investment to zero at the start of the period and plots its percentage gain or loss from that point, so that every line begins from the same place and every distance on the chart means the same thing.
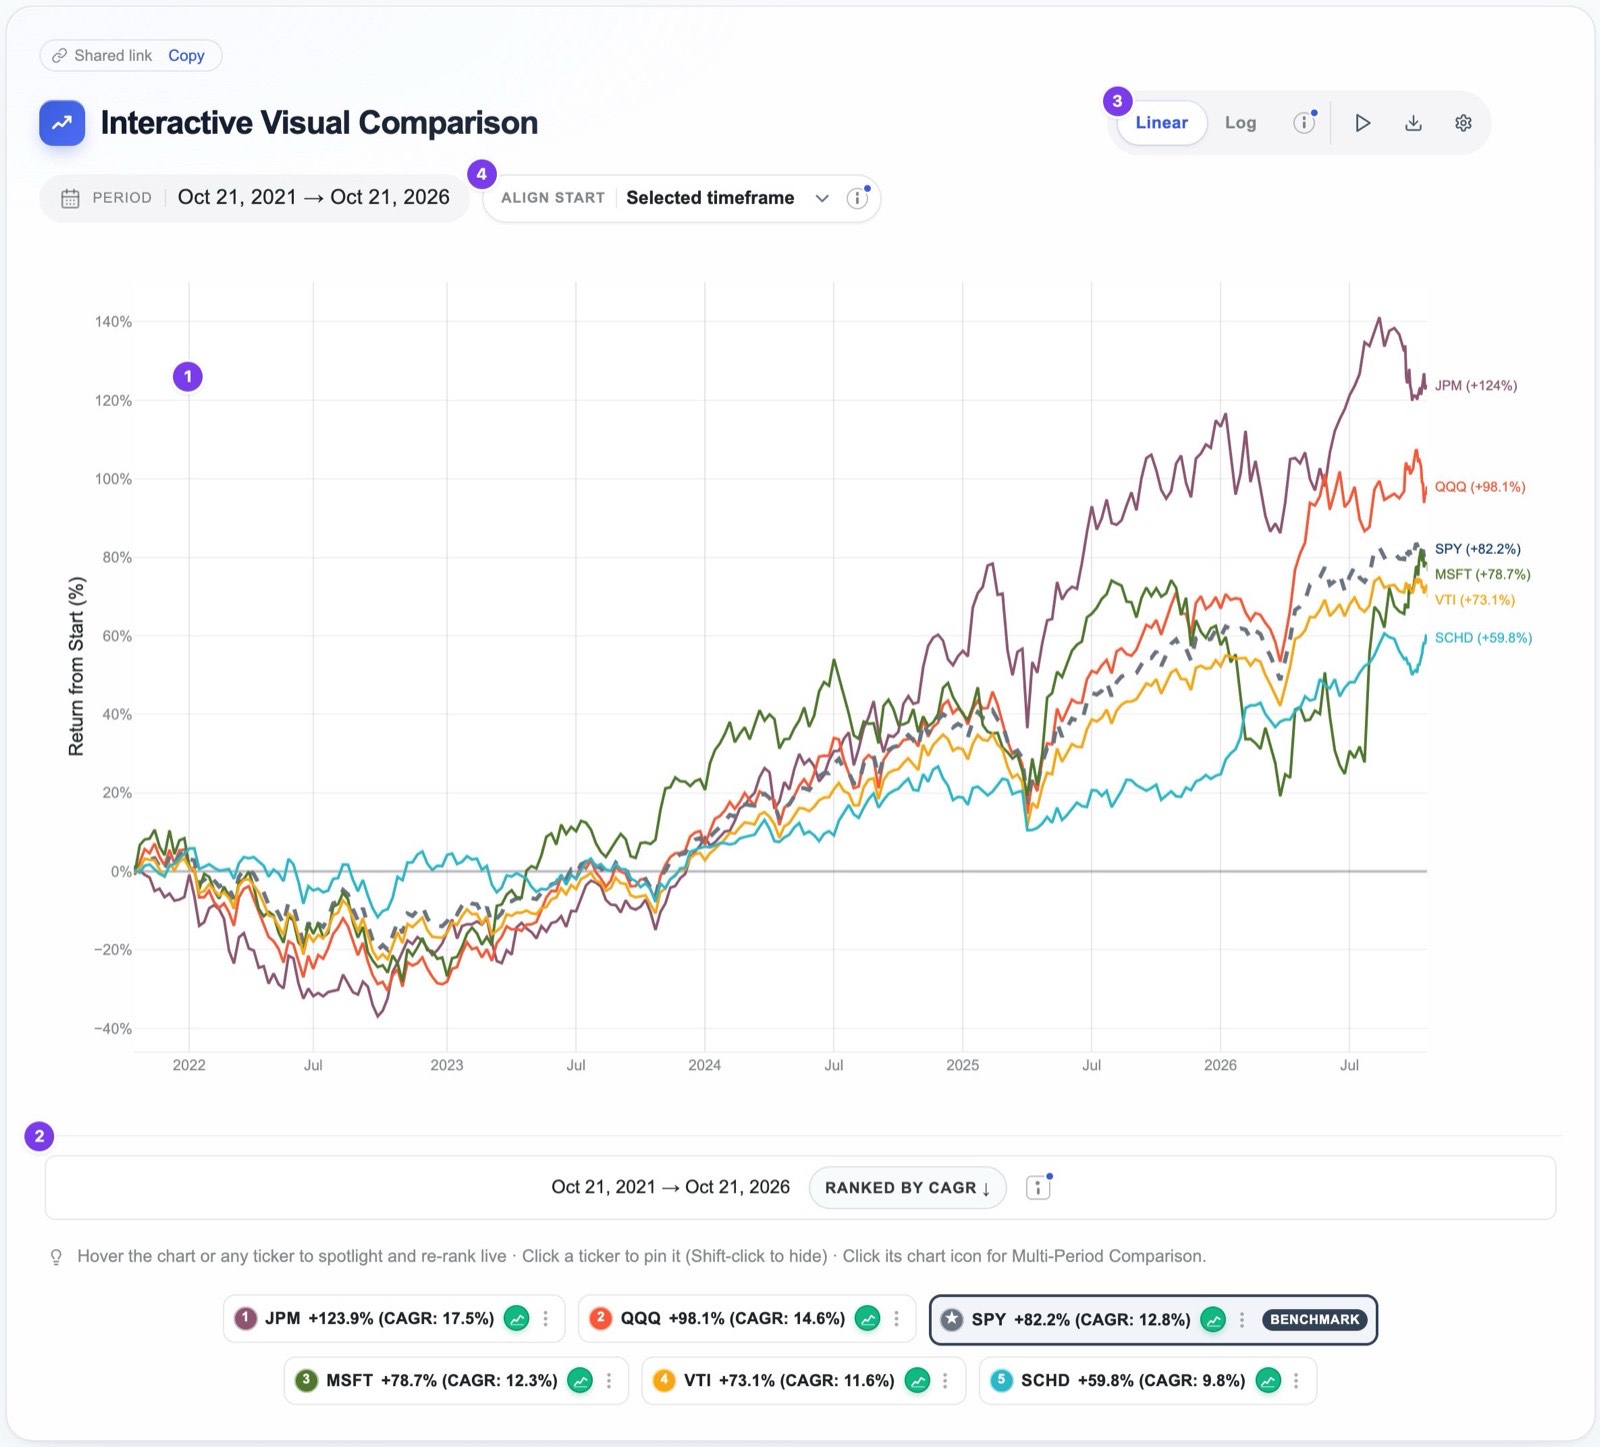
- 1The chart. Every line starts at 0% and shows total return from the first day of the period, with each ticker's final figure labelled at the right-hand edge.
- 2The legend. The chips are ranked by performance, together with the compound annual growth rate, and the benchmark is outlined.
- 3Linear or log scale. On a logarithmic scale equal percentage moves occupy equal heights, which makes long periods readable; on a linear scale a ten percent rise late in a long rally looks far larger than the same rise at its beginning.
- 4Align start. When one investment began trading partway through the period, this control can start every line from that later date, so that no ticker is penalised or flattered by a shorter history. Tickers without enough history for a period are shown as unavailable rather than silently compared.
Total return, not price return
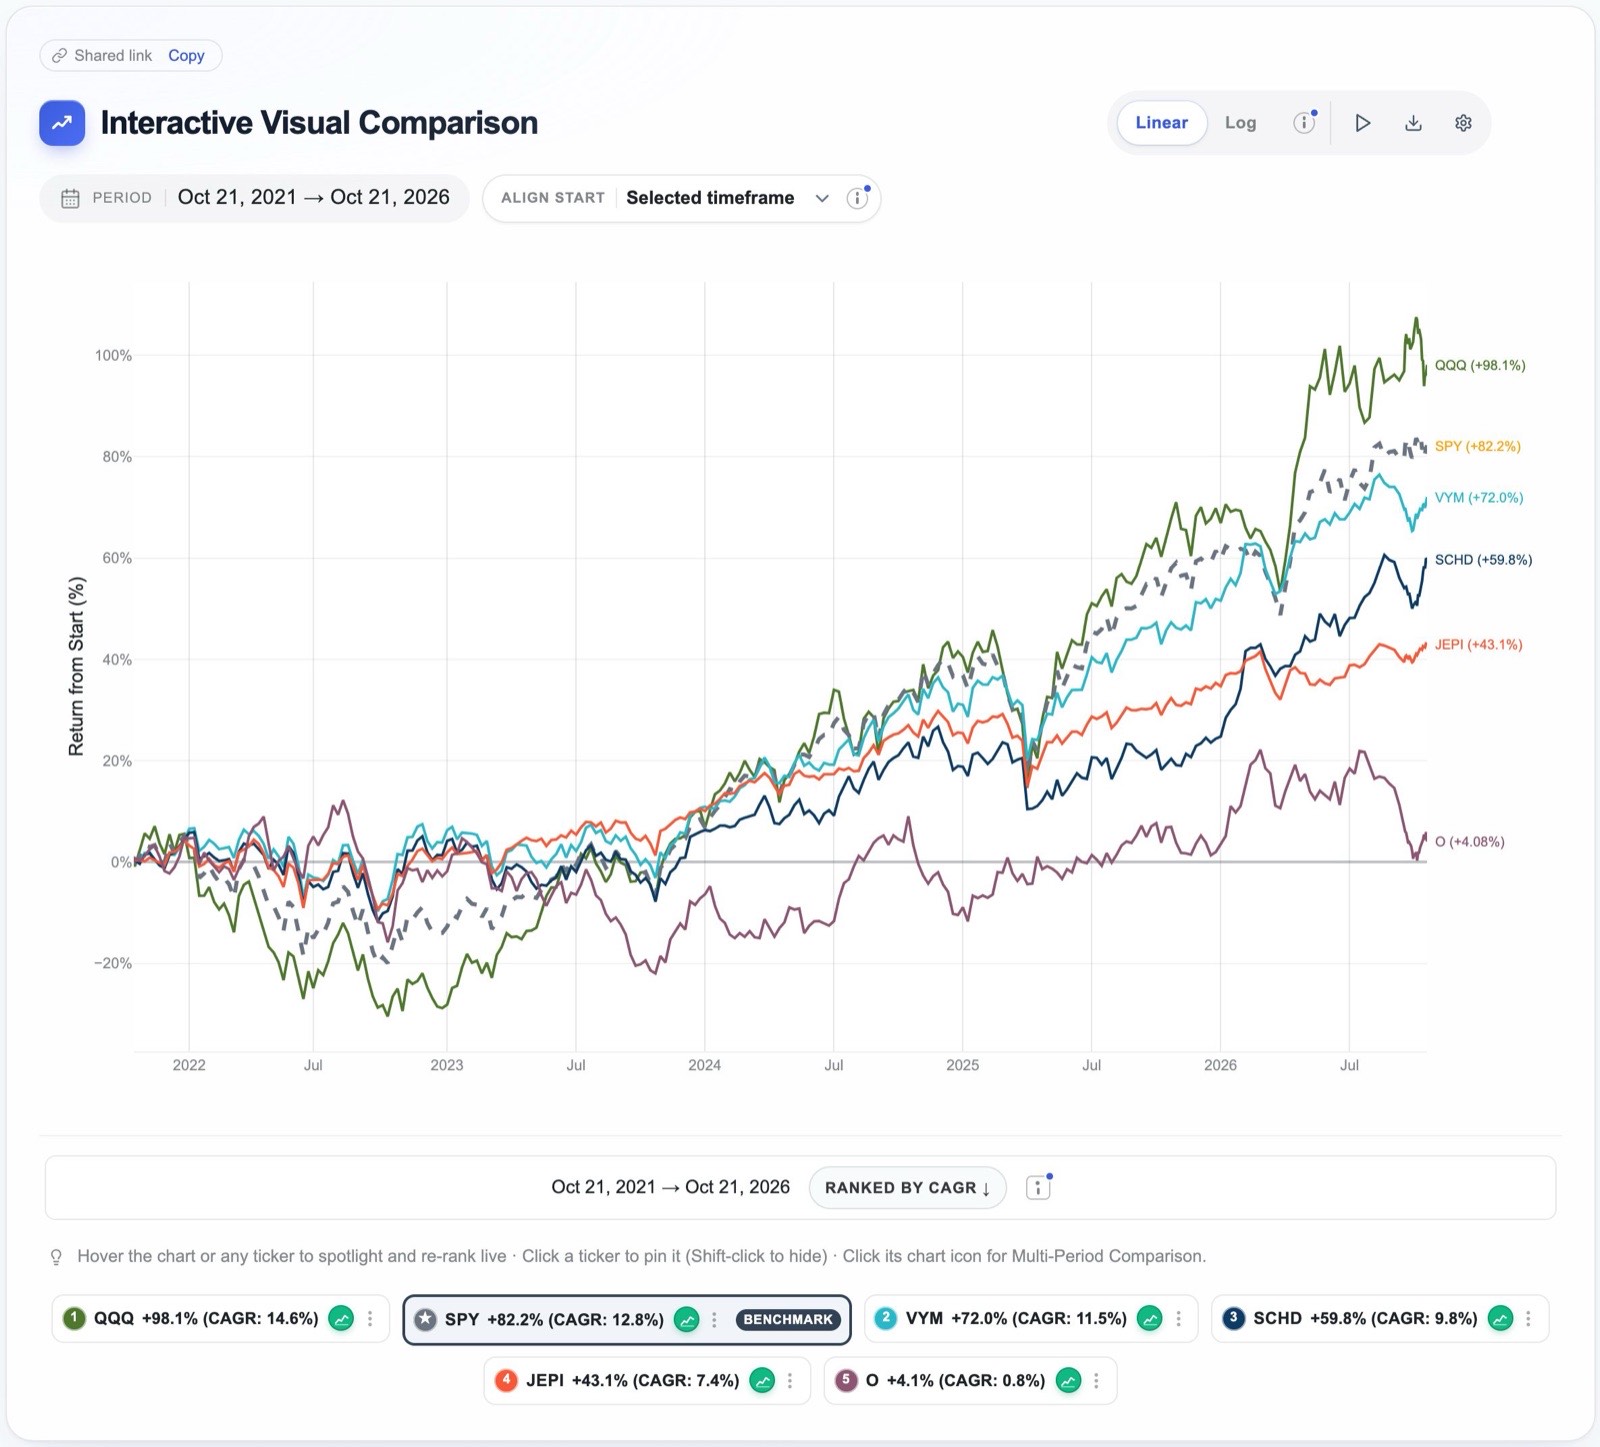
The second requirement of a fair comparison is that every investment is measured in the same way, and the most common failure here concerns dividends. A price chart records only the movement of the share price, but a fund that pays out a large part of its return as dividends will appear to lag on such a chart even when the investor who reinvested those dividends did very well. EasyCompare uses total return throughout, which assumes that every dividend is reinvested on the day it is paid. The difference over five years to October 21, 2026 was substantial:
| Five years | Price return | Total return | Difference |
|---|---|---|---|
| JEPI · covered-call income | −7.2% | +43.1% | 50.3 points |
| SCHD · dividend equity | +33.7% | +59.8% | 26.1 points |
| O · Realty Income | −19.7% | +4.1% | 23.8 points |
| VYM · high dividend yield | +49.0% | +72.0% | 23.0 points |
| SPY · S&P 500 | +70.4% | +82.2% | 11.8 points |
| QQQ · Nasdaq-100 | +92.2% | +98.1% | 5.9 points |
Price returns are from Yahoo Finance closing prices; total returns are from EasyCompare and agree with Yahoo's dividend-adjusted prices to within a tenth of a point.
On a price chart JEPI appears to have lost money over five years, whereas an investor who reinvested its income earned 43.1 percent. The ranking of these funds happens not to change, but the size of the gaps changes enormously, and any decision about how much income to give up for growth depends on exactly those gaps.
Sweep the timeline to see when the leaders changed
A chart that ends today shows only who was ahead at the finishing line, and it conceals how the race was run. Leadership in markets rotates, and an investment that led for two years may have peaked long before the end of the period. In EasyCompare, moving the cursor across the chart re-ranks the legend and the tooltip at that exact date, so you can watch the order change as you sweep from left to right.
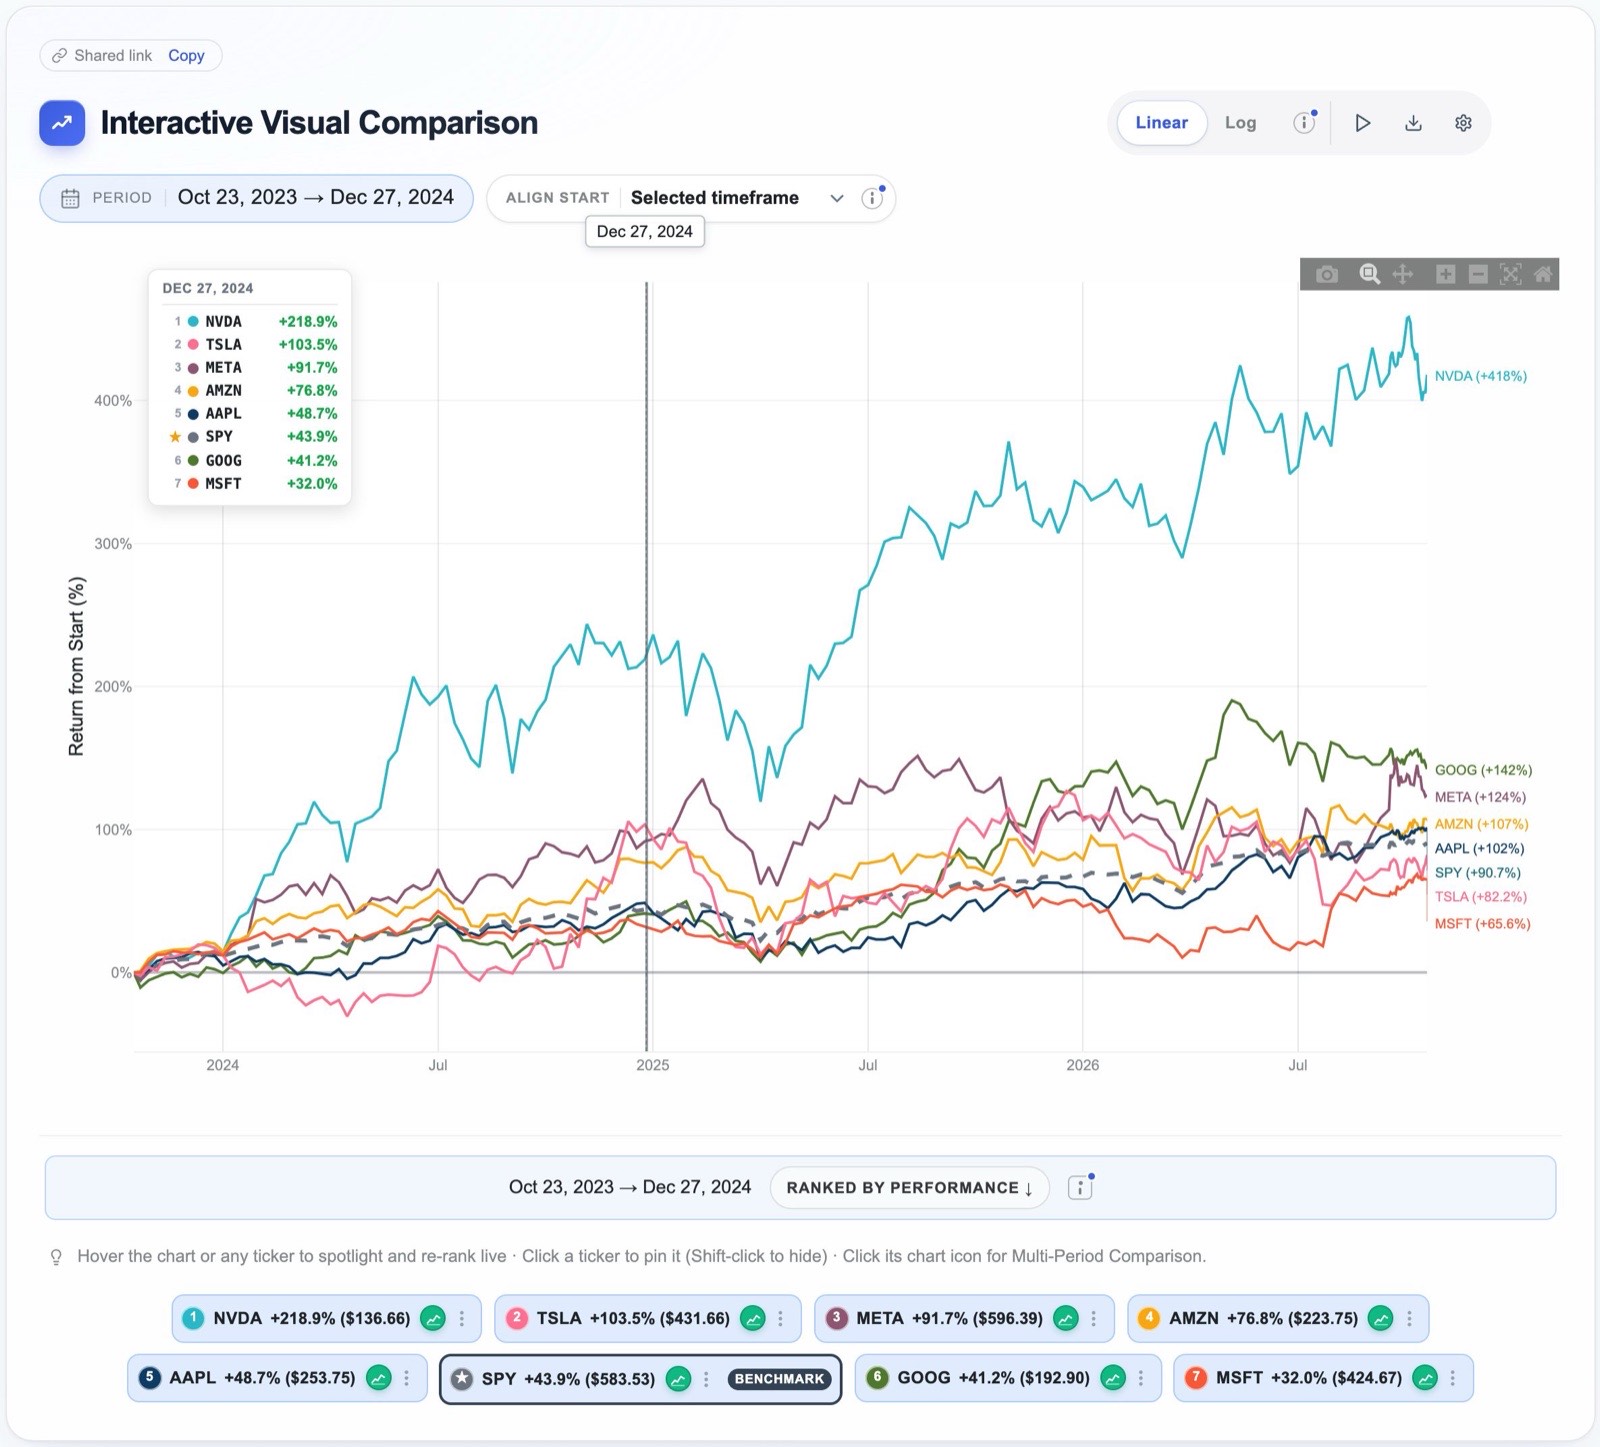
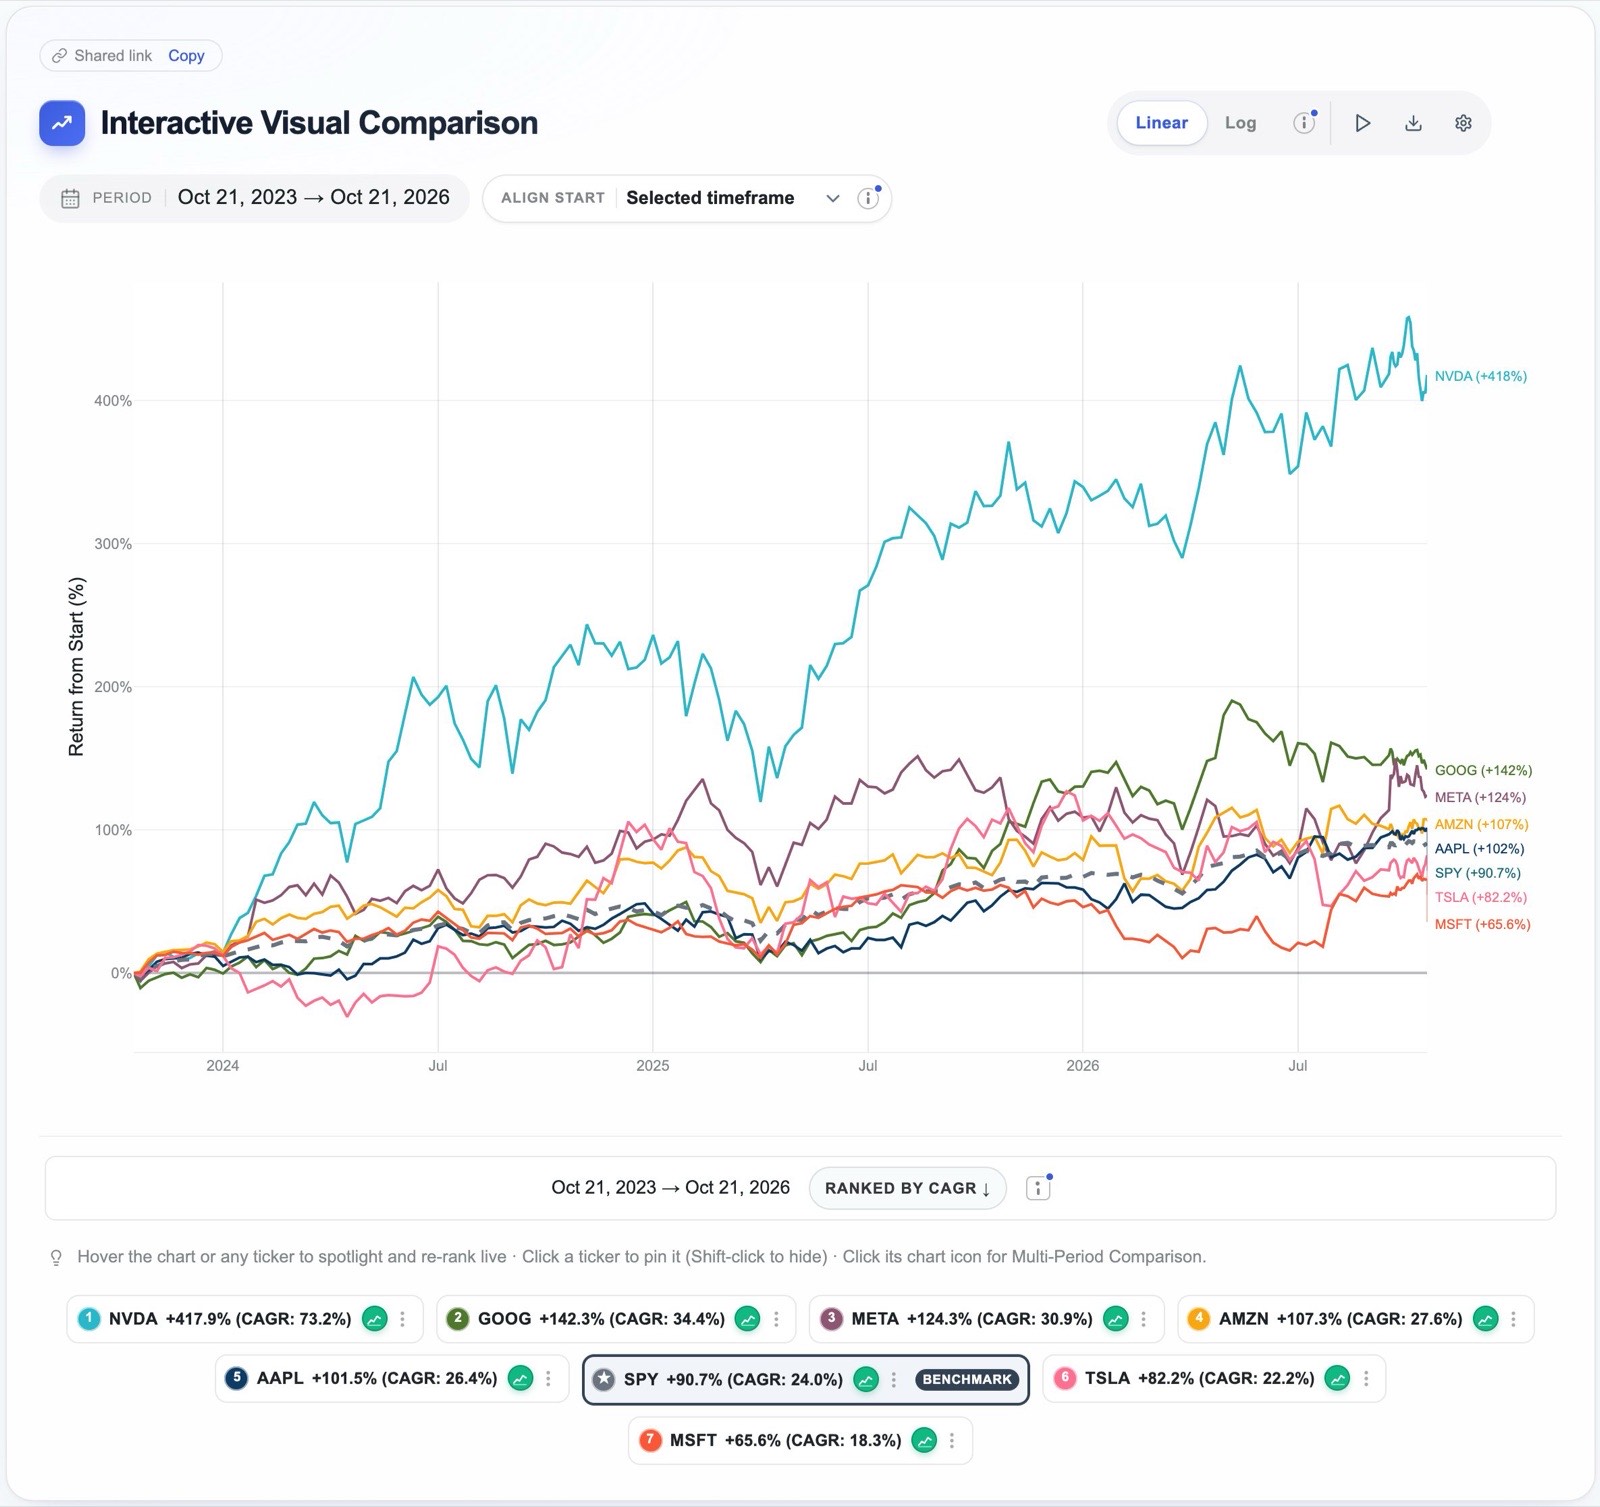
Measured from October 21, 2023, Tesla stood second among the Magnificent 7 at the end of 2024, with a gain of 103.5%, while Alphabet trailed SPY. By October 21, 2026 the positions had reversed: Alphabet had risen to second place with a gain of 142.3%, and Tesla, at 82.2%, had fallen behind SPY's 90.7%. NVIDIA led and Microsoft finished last at both dates. Someone who looked only at the final ranking would know none of this, and would therefore be unable to ask the most useful question, which is whether the reasons for each change are likely to persist.
Try it: sweep the Magnificent 7 over three years4Choose the window deliberately, and test it against hard times
Every return is measured between two dates, and the choice of those dates is part of the answer. A start date at a market low makes almost everything look impressive, while a start date at a peak makes almost everything look poor, and it is easy, whether by accident or by design, to select the window that supports a conclusion reached in advance. The defence is to choose windows deliberately, to look at several of them, and to include periods when markets were under strain, since those are the periods in which the differences between investments matter most.
EasyCompare offers three ways to set the window. The timeframe buttons select a period ending today, from one day to forty years. The custom range accepts any pair of dates. The scenario tests menu offers twenty historical episodes in three groups: corrections and crises, such as the dot-com bust, the 2007 to 2009 financial crisis, the COVID crash, the 2022 bear market and the April 2025 Liberation Day sell-off; bull periods, such as the 2009 to 2020 bull market and the AI boom that began in 2023; and mixed periods, such as the 2021 meme-stock mania and the rate-hike cycle of 2022 and 2023. Choosing a scenario applies its exact start and end dates to the chart, the legend and every metric in the rankings table.
The lesson of two crises
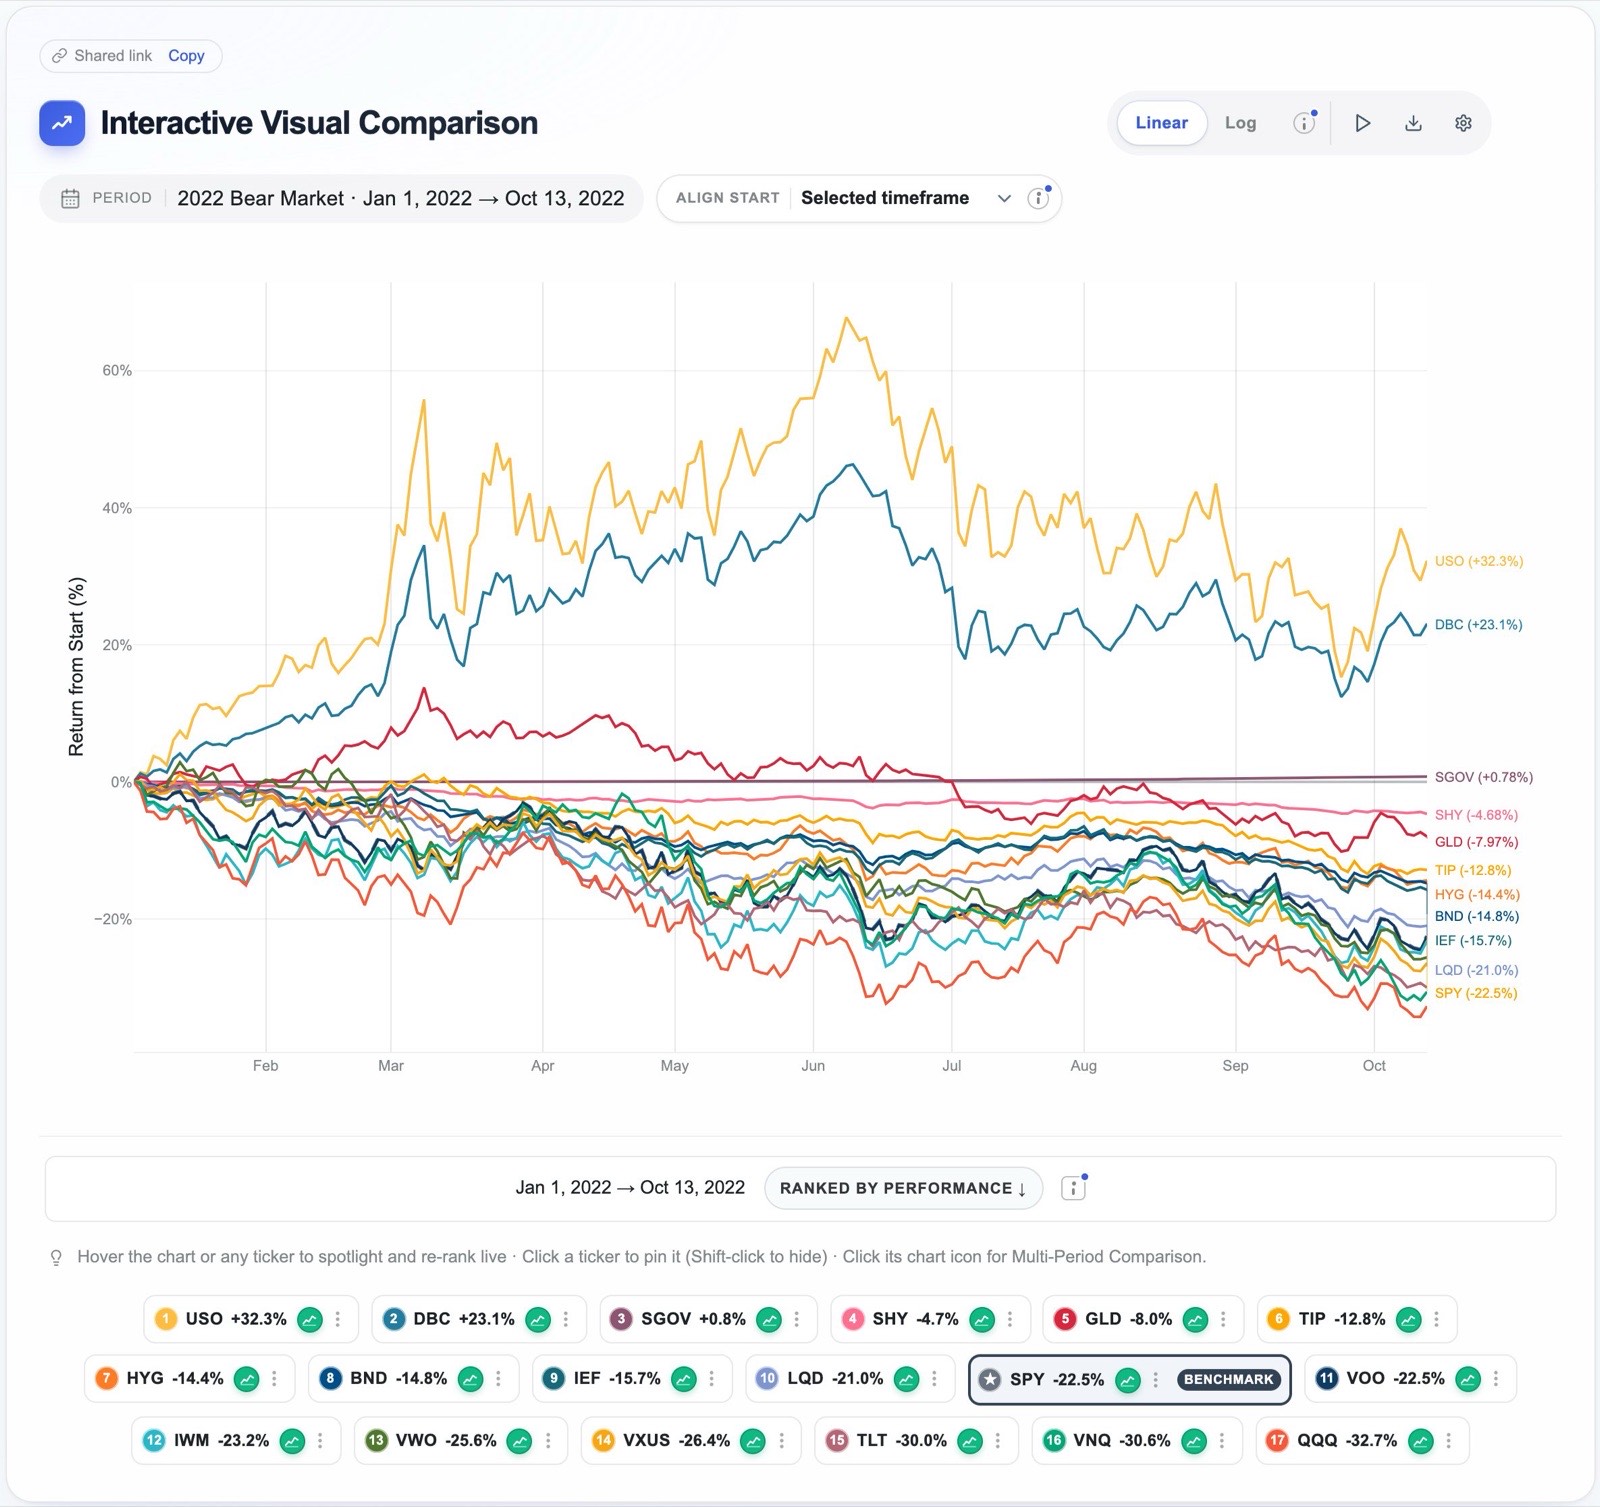
Scenario tests are most instructive when used in pairs, because an investment that protected you in one crisis may fail in the next. The table below shows how several asset classes behaved in the 2022 bear market, from January 1 to October 13, 2022, and in the COVID crash, from February 19 to March 23, 2020.
| Asset class | 2022 bear market | COVID crash |
|---|---|---|
| SPY · US stocks | −22.5% | −33.7% |
| QQQ · Nasdaq-100 | −32.7% | −27.9% |
| TLT · long Treasury bonds | −30.0% | +14.2% |
| BND · US bond market | −14.8% | −1.4% |
| GLD · gold | −8.0% | −3.6% |
| USO · crude oil | +32.3% | −56.4% |
| SHY · short-term Treasuries | −4.7% | +2.1% |
Total returns between the scenario dates. The screenshot below shows seventeen asset-class funds side by side in the 2022 scenario.
Long-dated Treasury bonds were the best refuge in the COVID crash and among the worst assets of 2022, when rising interest rates drove bond prices down at the same time as shares. Oil did precisely the opposite. Short-term Treasuries and, to a lesser degree, gold were the only assets in the table that limited their losses in both episodes, and short-term Treasuries did so at the price of earning very little in better times. The general point is that no asset is a reliable hedge against every kind of crisis, which is why it is worth testing a portfolio against several crises of different character before relying on any one of its parts for protection.
The arithmetic of losses
Losses and gains are not symmetrical. A fall of 20% requires a gain of 25% to recover, a fall of 33.7%, which was SPY's loss in the COVID crash, requires a gain of 50.8%, and a fall of 50% requires a gain of 100%. This is why the depth of a fall matters so much more than its headline percentage suggests, and why the drawdown measures in section 7 deserve close attention.
Scenario tests cannot be shared as a link, so to repeat this comparison, open Curated Lists, choose Every Major Asset Class, and select 2022 Bear Market from the Scenario tests menu.
5One period is an anecdote; many periods are evidence
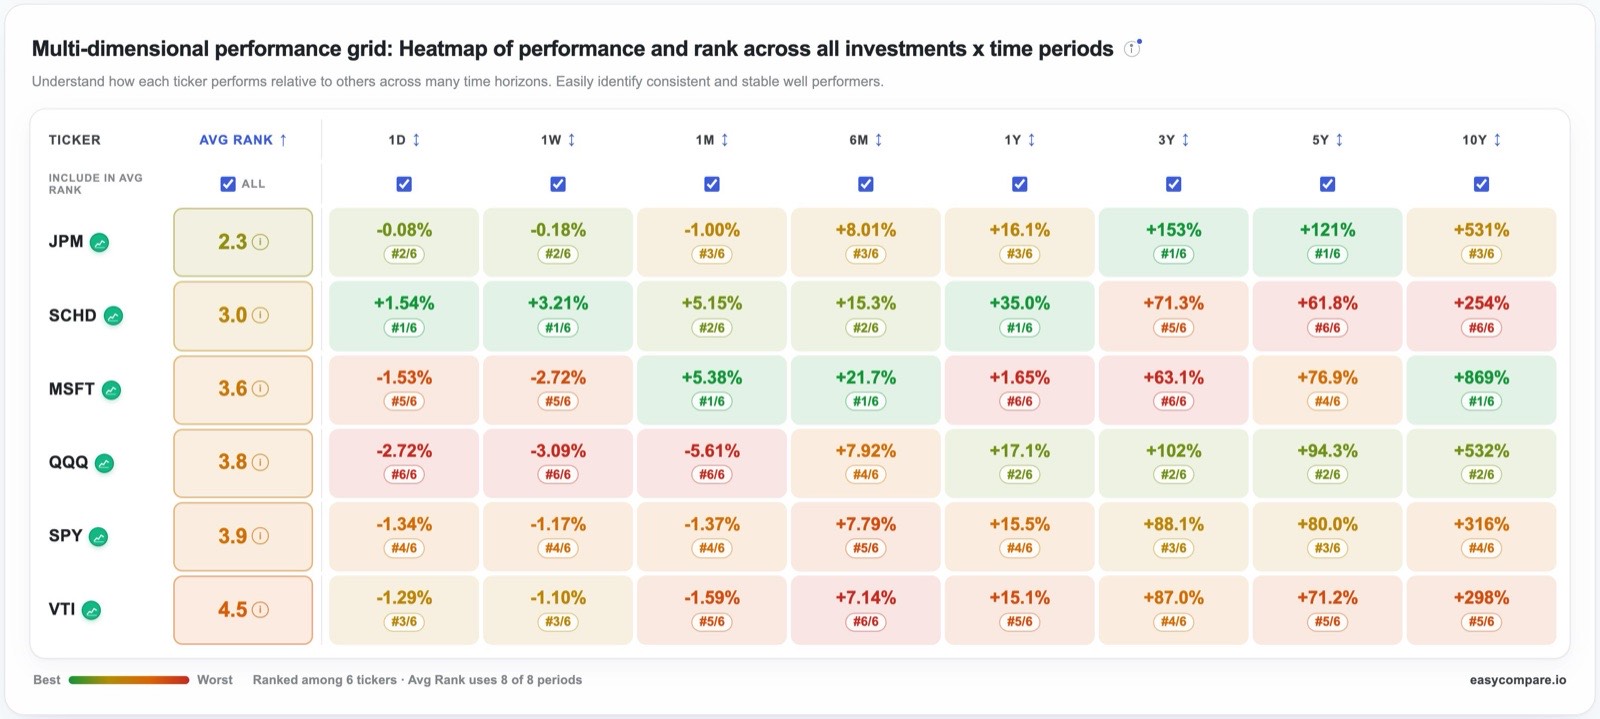
If the choice of window can change the answer, then the most reliable conclusions are those that survive many windows. An investment that beats its alternatives over one month, one year and ten years is telling you something different from one that won only over the most recent year, and the second kind of result is far more common than the first. Returning to our investor's six candidates, here is how they ranked over seven periods ending on October 21, 2026.
| Ticker | 1 month | 6 months | Year to date | 1 year | 3 years | 5 years | 10 years | Average rank |
|---|---|---|---|---|---|---|---|---|
| QQQ | −2.2%5 | +12.8%3 | +18.5%2 | +19.2%2 | +107.4%2 | +98.1%2 | +557.7%2 | 2.57 |
| SPY | −0.1%3 | +10.4%4 | +14.3%3 | +16.4%3 | +90.7%3 | +82.2%3 | +323.1%4 | 3.29 |
| SCHD | +3.6%2 | +13.7%2 | +29.5%1 | +32.5%1 | +68.7%5 | +59.8%6 | +250.1%6 | 3.29 |
| MSFT | +6.2%1 | +26.2%1 | +10.9%5 | +3.8%6 | +65.6%6 | +78.7%4 | +906.1%1 | 3.43 |
| JPM | −4.3%6 | +8.1%6 | +6.0%6 | +15.0%5 | +153.3%1 | +123.9%1 | +535.1%3 | 4.00 |
| VTI | −0.3%4 | +9.6%5 | +14.1%4 | +15.9%4 | +89.5%4 | +73.1%5 | +304.9%5 | 4.43 |
The small number beside each return is its rank among the six; first place is shaded green and last place orange.
Each of three candidates could be presented as the obvious choice, depending on which column one chose to quote. Microsoft was first over one month, six months and ten years, yet last over one and three years. JPMorgan was first over three and five years, yet last over one month, six months and the year to date. SCHD led over the year to date and the past year, yet came last over five and ten years. QQQ, by contrast, was never first in any period, but it was second in five of the seven and therefore has the best average rank. Consistency of this kind is easy to overlook when attention is drawn to whichever investment won the most recent period, and it is often the more valuable quality.
The rank heatmap
EasyCompare presents this analysis directly beneath the chart as a rank heatmap. Each row is an investment and each column a period, every cell shows the return together with its rank, and the colour runs from green for the best rank to red for the worst, so that consistent performers appear as rows of a single colour. The Avg Rank column summarises each row, and the checkboxes above the columns let you decide which periods count towards that average, so that, for example, a long-term investor can exclude the shortest periods.
The rankings table offers the same view in another form. Its Multi-Period Presets tab lists the return for each chosen period beside a ranked badge, and its Beat column counts the periods in which each investment outperformed the benchmark, so that a figure such as 5/8 summarises a whole row at a glance.
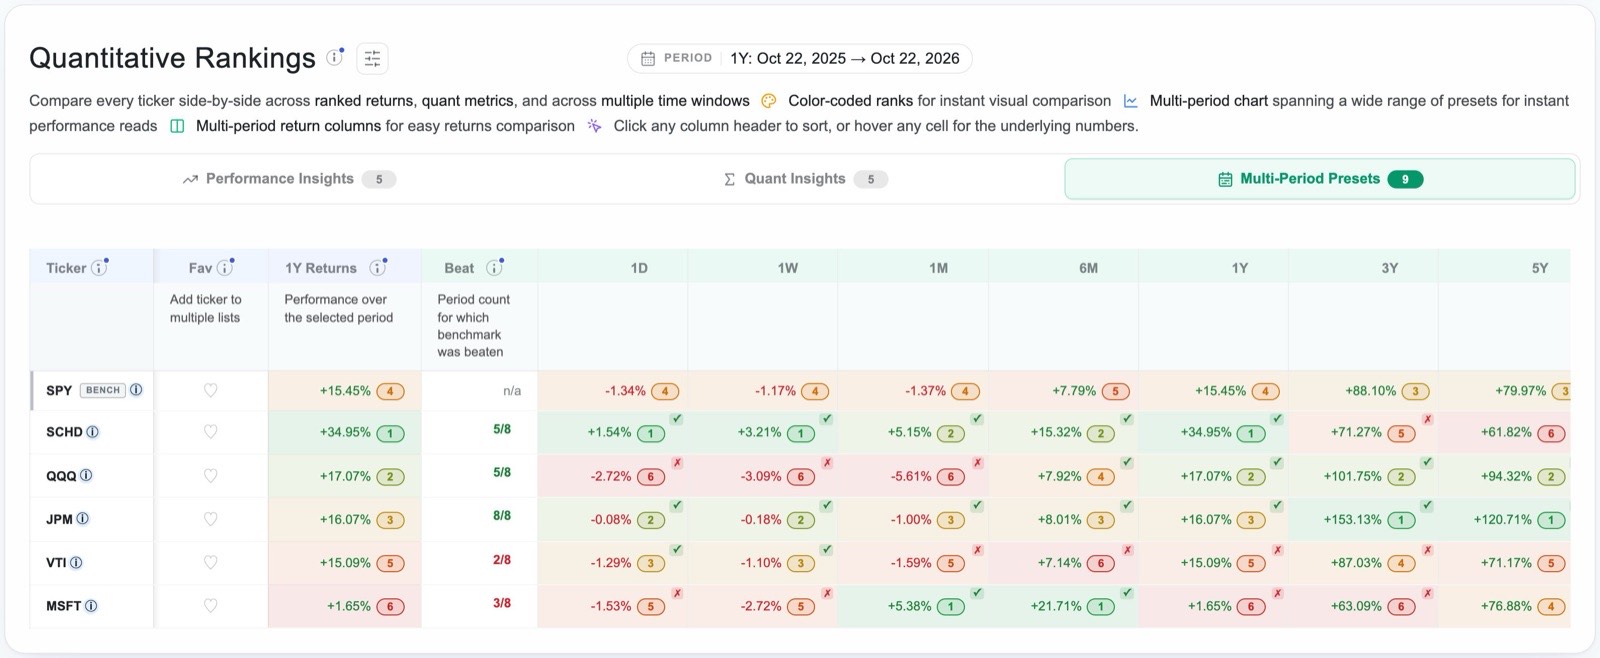
The same principle, applied to every ETF in the market rather than to a list of your own choosing, is the basis of our sister app, BetterThanSPY, which ranks funds by the number of periods in which they beat a benchmark.
Try it: the running example with its heatmap6Settle a head-to-head question with the multi-period matchup
Many practical decisions reduce to a choice between two investments: whether to hold SCHD or simply keep SPY, or whether a particular stock has earned its place against the fund it would replace. For these questions EasyCompare provides the multi-period matchup, which places one investment against another across every period at once. You open it by clicking the small chart icon on any legend chip, or the sparkline in any row of the rankings table.
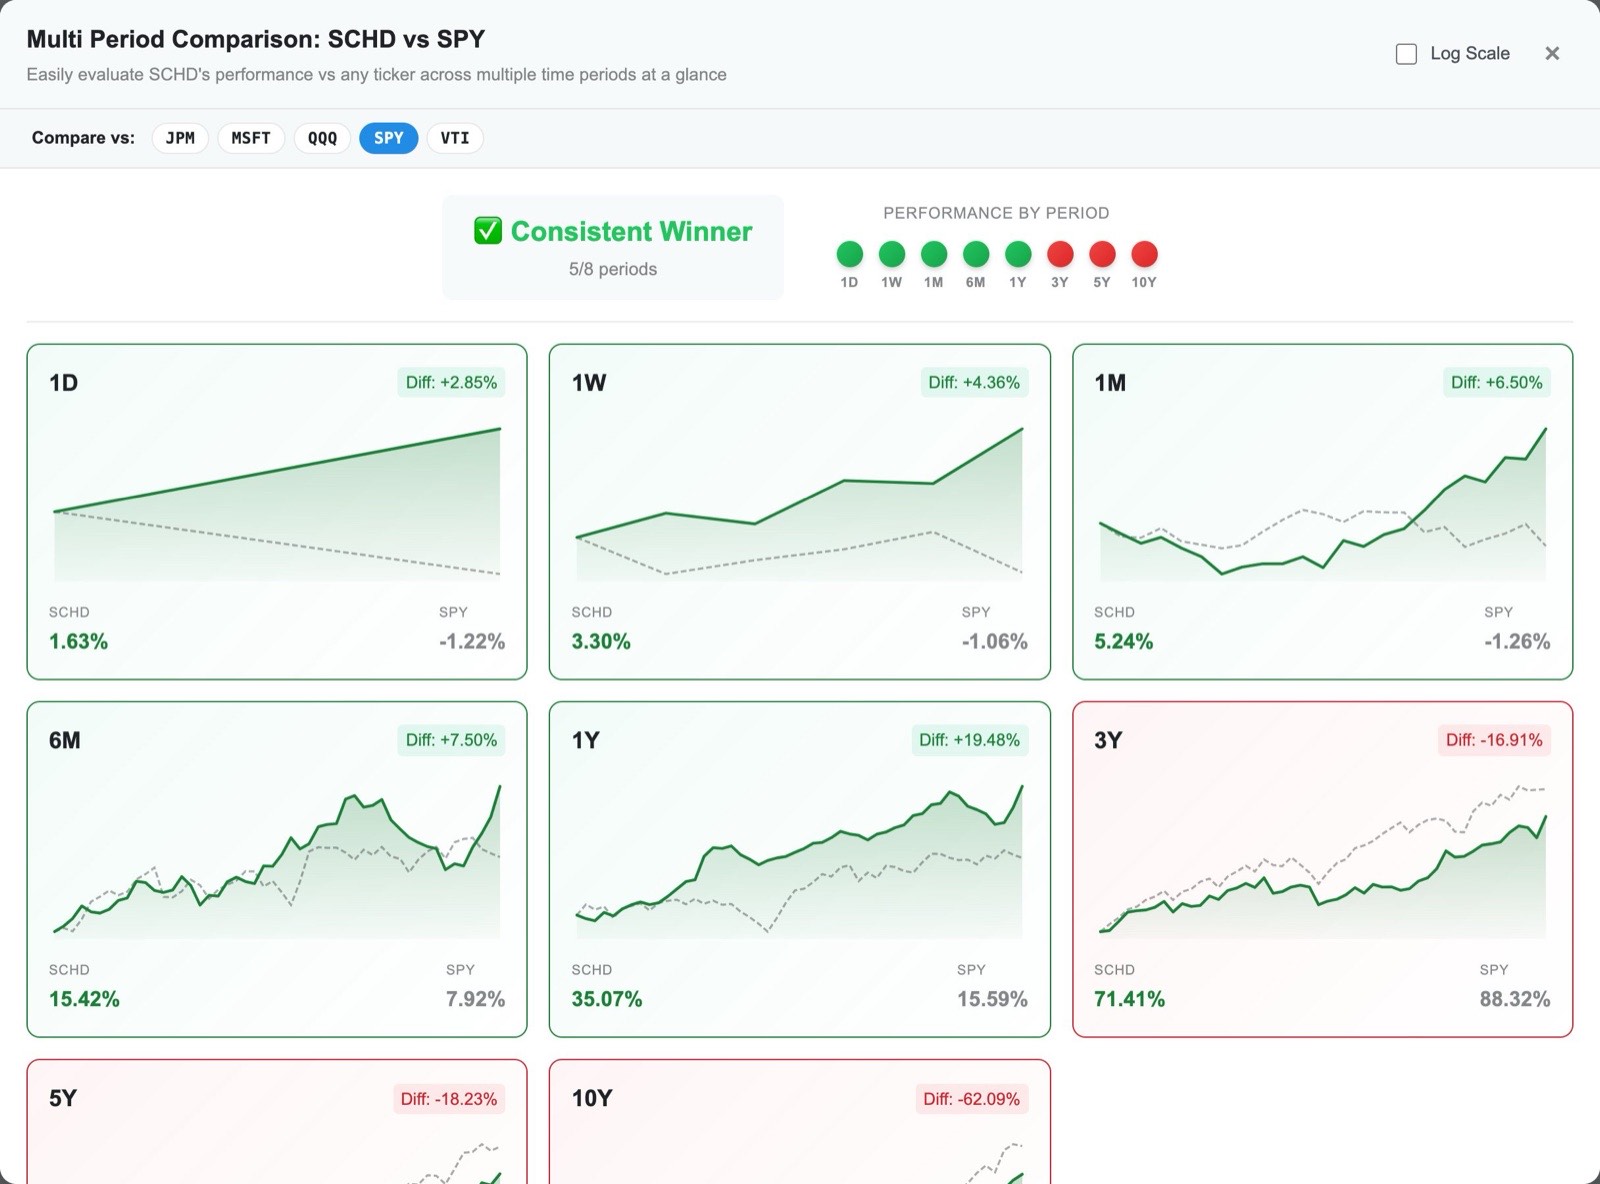
The matchup shows a card for each period, from one day to ten years, with a small chart of both investments, each one's return, and the difference between them. A summary at the top counts the periods won, and a row of coloured dots shows the pattern of wins and losses in order of length. The chips labelled Compare vs let you replace the benchmark with any other ticker in your list, so that one investment can be tested against several rivals in turn, and a log-scale option is available for the longer periods.
In our investor's case the pattern is the most informative part of the result. SCHD beat SPY in every period from one day to one year and lost in every period from three years upwards. Its advantage, in other words, is recent, and the decision to buy it turns on whether she believes the conditions that favoured dividend-paying value shares in the past year will continue, rather than on any long record of superiority. The matchup does not answer that question, but it makes clear that it is the question that needs answering, which is often the most useful thing an analysis can do.
The matchup is especially useful in three situations: when you are deciding between two specific alternatives, when you want to know whether an investment's lead is recent or durable, and as a final check before adding anything to a portfolio.
Risk and reward
7How rough was the ride? Volatility and drawdown Pro
Two investments with the same return can be very different to own. One may rise steadily, while the other swings wildly and falls by half along the way, and experience shows that many investors sell during such falls and so never receive the return the chart records. Risk metrics describe the character of the journey, and the first two to understand are volatility and drawdown.
Volatility measures how widely an investment's returns vary, expressed as an annual percentage. SPY's volatility of 17.1% over the five years to October 21, 2026 means that in roughly two years out of three its return would be expected to fall within about seventeen percentage points of its average. Over the same period USMV, a fund designed for low volatility, measured 12.3%, SCHD 14.4%, Microsoft 28.2% and NVIDIA 51.9%.
Maximum drawdown is the largest fall from a peak to a subsequent low within the period, and EasyCompare shows the dates of both the peak and the trough. It is perhaps the most intuitive of all risk measures, because it describes the worst loss that an investor who bought at the top would have had to sit through. Alongside it, the current drawdown, shown in the table as "Now", records how far each investment stands below its highest point in the period today.
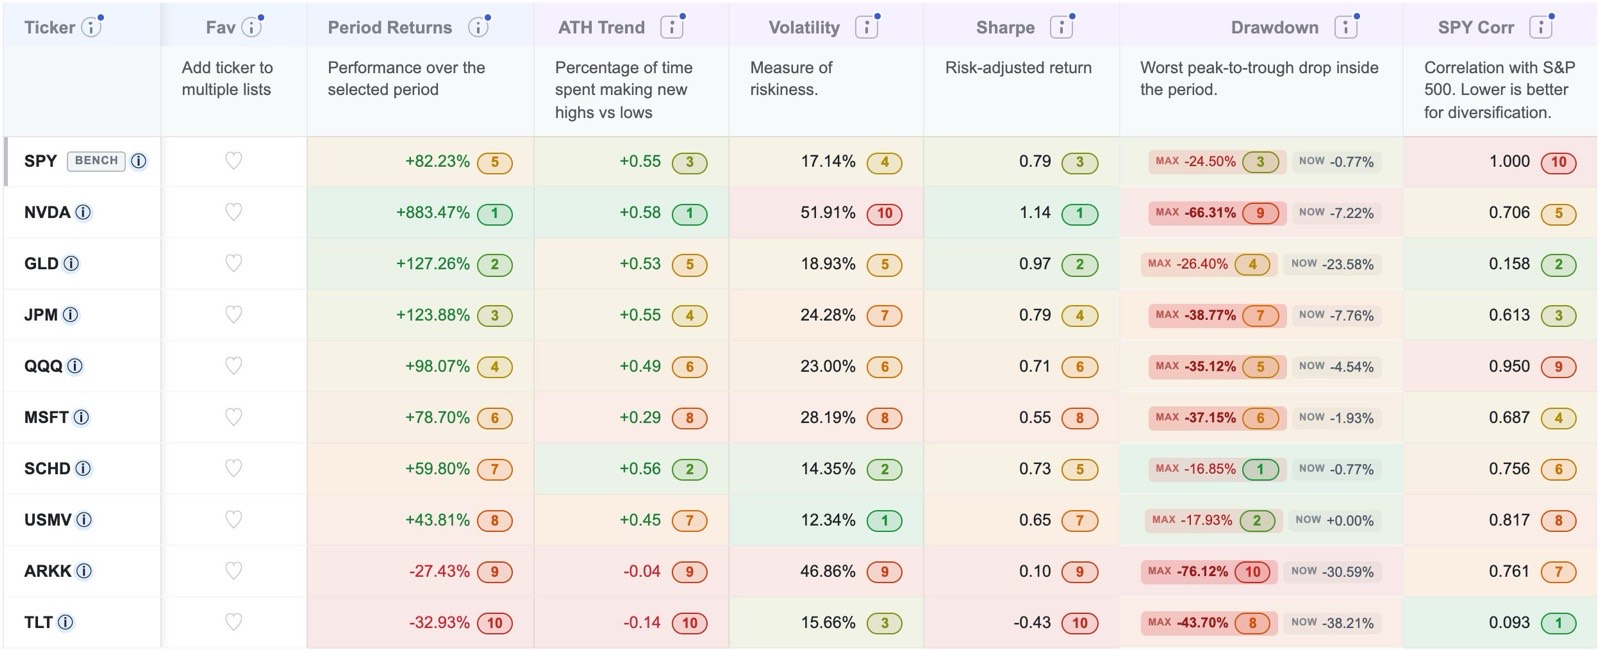
| Five years | Return | Max drawdown | Peak to trough | Gain needed to recover |
|---|---|---|---|---|
| SPY | +82.2% | −24.5% | Jan 2022 → Oct 2022 | +32.5% |
| SCHD | +59.8% | −16.8% | Jan 2022 → Sep 2022 | +20.2% |
| QQQ | +98.1% | −35.1% | Nov 2021 → Nov 2022 | +54.1% |
| TLT | −32.9% | −43.7% | Dec 2021 → Oct 2023 | +77.6% |
| NVDA | +883.5% | −66.3% | Nov 2021 → Oct 2022 | +196.7% |
| ARKK | −27.4% | −76.1% | Nov 2021 → Dec 2022 | +318.4% |
Two observations deserve emphasis. The first is that a spectacular final return can conceal a drawdown that very few people would have endured: NVIDIA's 883% gain over five years included a fall of two thirds, from which it needed to almost triple merely to recover. The second is that drawdowns are not confined to adventurous investments, since the long Treasury fund TLT, often regarded as a safe holding, fell 43.7% from its peak and still stood 38% below it at the end of the period.
How to use them
- Decide before you buy how large a fall you could hold through without selling, and treat any investment whose drawdown exceeds that figure with suspicion, however attractive its return.
- Compare drawdowns over the same window, and look at them inside the scenario tests of section 4 as well as over recent periods, because a calm recent year says little about behaviour in a crisis.
- Read volatility and drawdown together. Volatility describes the typical size of the swings, whereas drawdown describes the single worst episode, and an investment can be calm most of the time and still suffer one severe fall.
9ATH trend: does it keep making new highs? Pro
Two investments can finish a period with the same return by very different routes. One may climb steadily, setting new highs month after month, while the other falls sharply, recovers late, and arrives at the same place by way of a violent rally. A single return figure cannot distinguish between them, and volatility distinguishes between them only partly, because it measures the size of the swings rather than their direction over time.
ATH trend, short for all-time-high trend, is a metric developed for EasyCompare to capture this difference. For every day in the period it notes whether the investment set a new high for the period or a new low, weights recent days more heavily than earlier ones, and expresses the balance on a scale from −1 to +1. A value near +1 describes an investment that kept making new highs throughout, a value near zero describes one that spent the period going sideways or recovering lost ground, and a negative value describes one that kept making new lows.
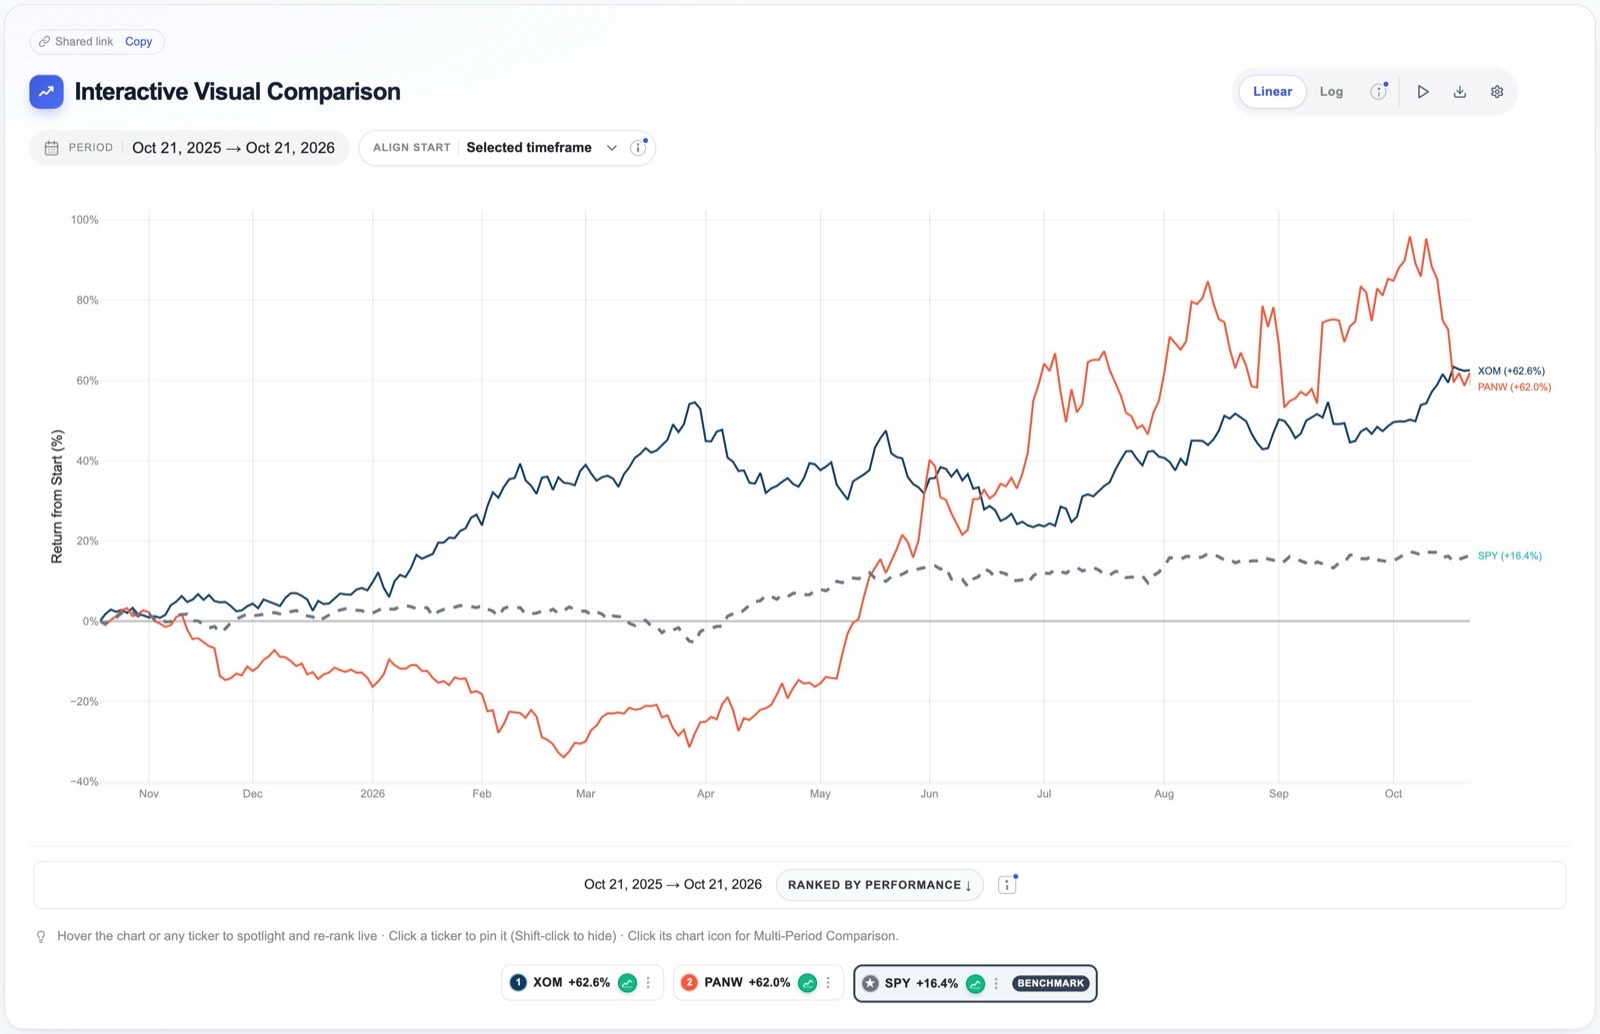
Exxon Mobil (XOM) and Palo Alto Networks (PANW) offer an unusually clear example. Over the year to October 21, 2026, Exxon returned 62.6% and Palo Alto 62.0%, so that on return alone they were indistinguishable. Their paths, however, could hardly have been more different. Exxon rose through the winter, gave back part of its gain in the spring and climbed again from June, whereas Palo Alto fell by about a third by March and recovered only with a sharp rally in the summer. The table records the difference:

Exxon's ATH trend was +0.46 against Palo Alto's +0.19, and the other measures agree with it: Exxon's volatility was 26.1% against 49.1%, its maximum drawdown −20.1% against −36.0%, and its Sharpe ratio 2.00 against 1.23. Exxon's correlation with the S&P 500 over the year was in fact slightly negative, at −0.34, which made it a genuine diversifier for an investor who held the index.
Spotting a fading leader
ATH trend is particularly useful when the same investment is examined over a long window and a short one. Broadcom (AVGO) returned 305% over the three years to October 21, 2026, with a three-year ATH trend of +0.51, which describes a strong and persistent advance. Over the most recent six months, however, it lost 15.7% and its ATH trend was −0.21, meaning that it had spent that time setting new lows rather than new highs. Caterpillar showed a similar pattern, with a three-year gain of 211% but a six-month loss of 7.1% and a six-month ATH trend of −0.16. A divergence of this kind does not predict that the decline will continue, but it does show that the long-term record no longer describes the present, which is exactly the situation in which an investor relying on that record should look more closely.
How to use it
- Use ATH trend to separate investments with similar returns, since it rewards a steady advance and penalises a return that arrived in a single burst.
- Compare the figure for a long window with the figure for a short one in order to see whether a long-standing leader is still leading.
- Pair it with maximum drawdown when you want investments that are both steady and shallow in their falls. Like every metric here, it describes the past and makes no forecast.
Chapter 8 of our free book, The Non-Math Quant Guide, explains ATH trend in more detail.
Try it: Exxon against Palo Alto Networks10Know what you actually own: correlation and ETF holdings
Correlation and the illusion of diversification Pro
Diversification works only when holdings respond differently to the same events, and owning many funds does not guarantee that they do. SPY correlation measures how closely the daily movements of an investment have followed those of the S&P 500, on a scale from −1 to +1. A value near +1 means that the investment has moved almost in step with the index, a value near zero means that its movements have been largely unrelated, and a negative value means that it has tended to move the other way.
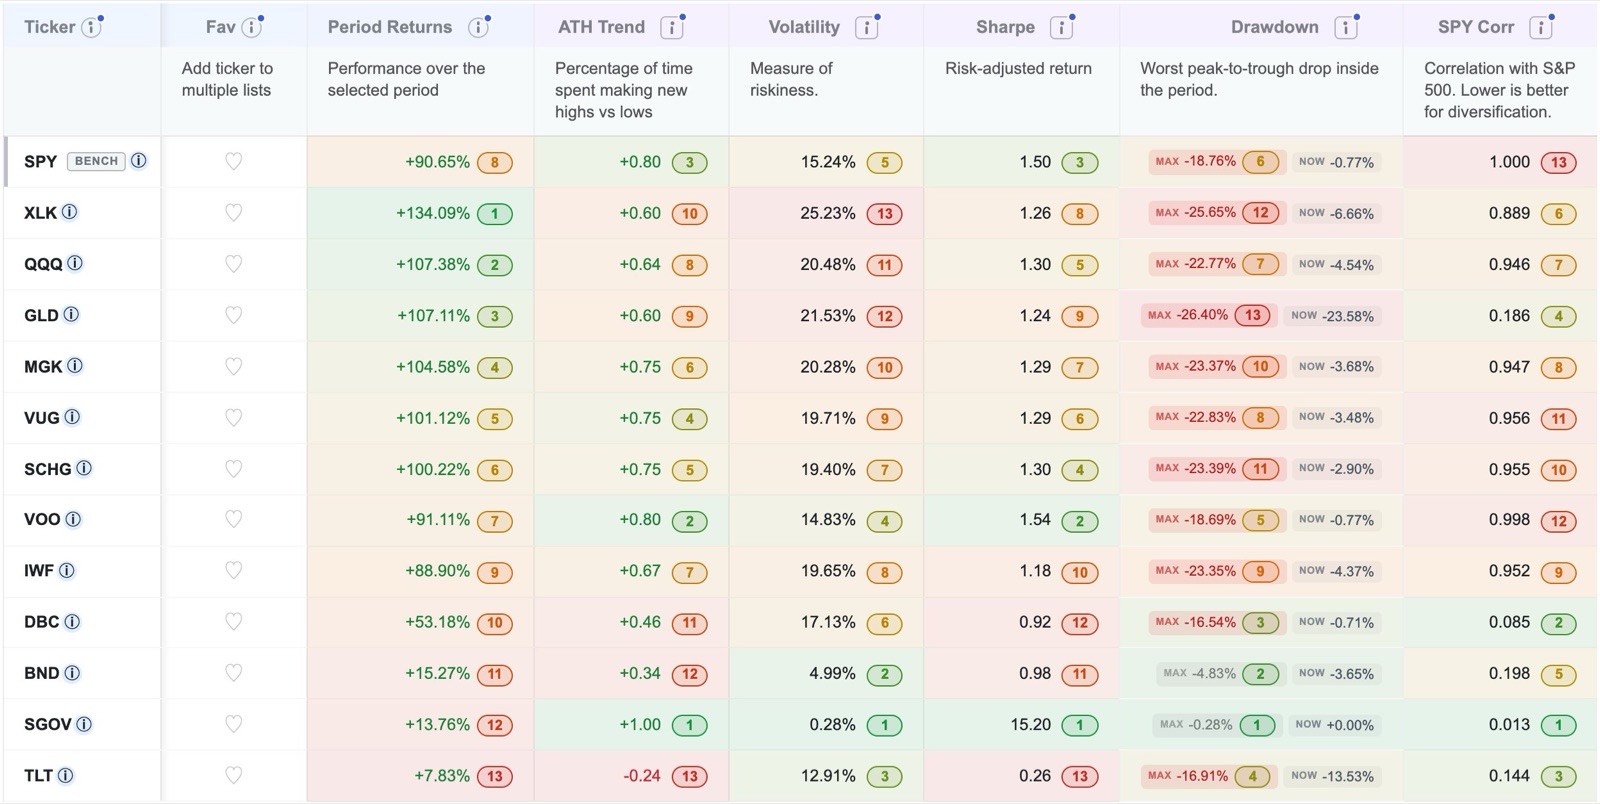
An investor who owned VOO, QQQ, VUG, SCHG, MGK, IWF and XLK over the three years to October 21, 2026 might have believed that seven funds made a diversified portfolio. Their correlations with the S&P 500, however, ranged from 0.89 to 1.00, which means that in practice they were a single bet on large American companies, and above all on the largest technology companies, held in seven slightly different forms. By contrast, the bond fund BND had a correlation of 0.20, gold 0.19, long Treasuries 0.14, the commodity fund DBC 0.09 and the Treasury-bill fund SGOV 0.01; each of these added something genuinely different. Low correlation is not a promise of protection, as the experience of long Treasuries in 2022 showed, but high correlation is a reliable sign that a holding adds little diversification.
An ETF against its own holdings
A fund is itself a comparison waiting to be made, because its return is the weighted result of its holdings, some of which do much better than the fund and many of which do worse. EasyCompare can plot any eligible ETF against all of its holdings at once. Click Compare ETF Holdings beside the ticker box and choose a fund; the app loads every holding, sets the ETF as the benchmark, and summarises the result in a scorecard above the chart.
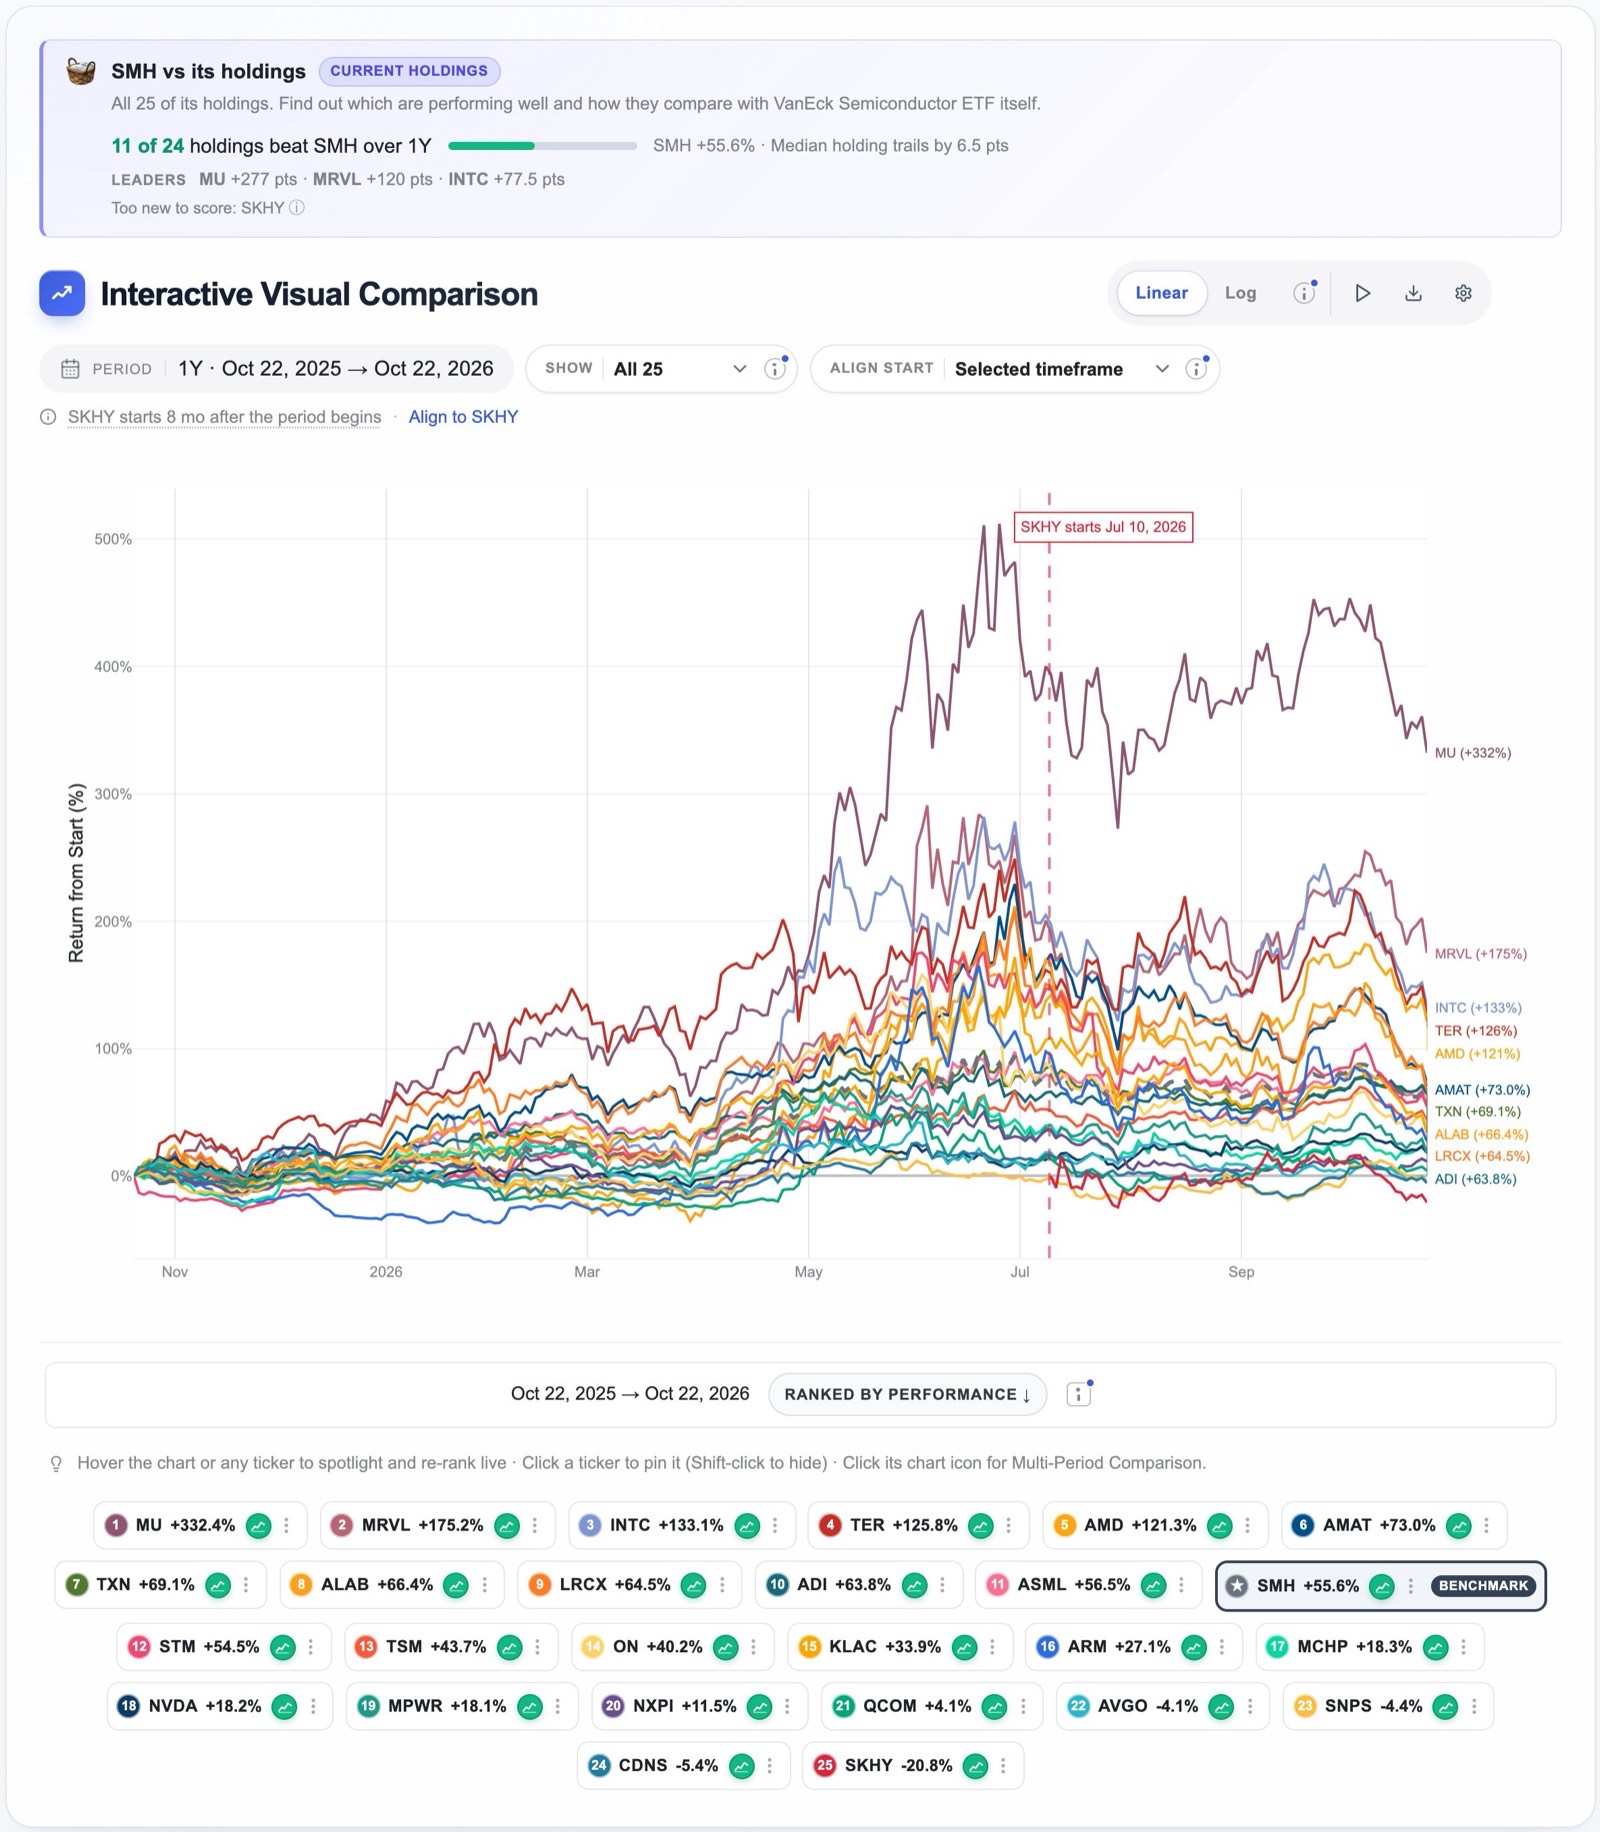
Over the year to October 22, 2026, SMH returned 55.7%, yet only 11 of the 24 holdings with a full year of data beat it, and the median holding trailed the fund by 6.5 points. The fund's return was carried by a handful of large winners, led by Micron, Marvell and Intel. Its largest holding, NVIDIA, which made up about a fifth of the fund, returned only 18.3%. Two practical lessons follow. An investor who had tried to improve on the fund by picking a few of its members would more likely than not have chosen worse than the fund itself, and the ETF's result depended heavily on a small number of names, which is a form of concentration that its long list of holdings conceals.
Try it: SMH against its holdings11Use the metrics together
Each metric answers a narrow question, and any one of them can mislead when it is read alone. A high return may have been bought with an unbearable drawdown, a high Sharpe ratio may reflect a short and unusually calm window, and a low correlation may belong to an investment that has simply done badly. The sensible procedure is to begin with the question you are actually asking, sort by the metric that expresses it most directly, and then read across each row to see whether the other metrics confirm or qualify the first impression.
The rankings table is designed for this procedure. Its three tabs group the columns into Performance Insights, Quant Insights and Multi-Period Presets; clicking any column header sorts by it; every value carries a coloured rank badge, so that strengths and weaknesses stand out across a row; and the information icon on each header opens a plain-English explanation of the metric. The benchmark for each list is chosen in the Configuration tab of the settings panel, and the Configure columns button beside the table's title lets you hide the columns you do not use.
Two short examples, both drawn from the five-year table in section 7, show the procedure at work.
- Did anything beat SPY without taking more risk? Sorting by return shows that four of the ten investments beat SPY's 82.2%, namely NVIDIA, gold, JPMorgan and QQQ. Reading across to the drawdown column shows that every one of them also suffered a deeper fall than SPY's 24.5%, so in this group a higher return was never available without a larger loss along the way.
- What was the calmest route, and what did it cost? Sorting by volatility puts USMV first at 12.3% and SCHD second at 14.4%, and both had much shallower drawdowns than SPY. Reading across to return shows the price of that calm, since USMV returned 43.8% and SCHD 59.8% against SPY's 82.2%. Whether the trade was worthwhile depends on the investor, and the table makes the trade explicit.
The volatility, Sharpe, drawdown, SPY correlation and ATH trend columns are part of Pro. Returns, ranks, the heatmap, the multi-period columns and the matchup are available on the free plan.
Fast markets
12Intraday comparison: watching a trading day unfold Pro
Most of this tutorial concerns periods of months and years, but some questions can only be answered within a single trading session. When you choose the 1D, 2D or 3D timeframe, EasyCompare switches to fifteen-minute price bars, measured from the previous day's close, with the overnight and weekend gaps removed so that the sessions join together. The view refreshes automatically during market hours, and every other feature, from the ranked legend to the sweep, works on intraday data as it does on daily data.
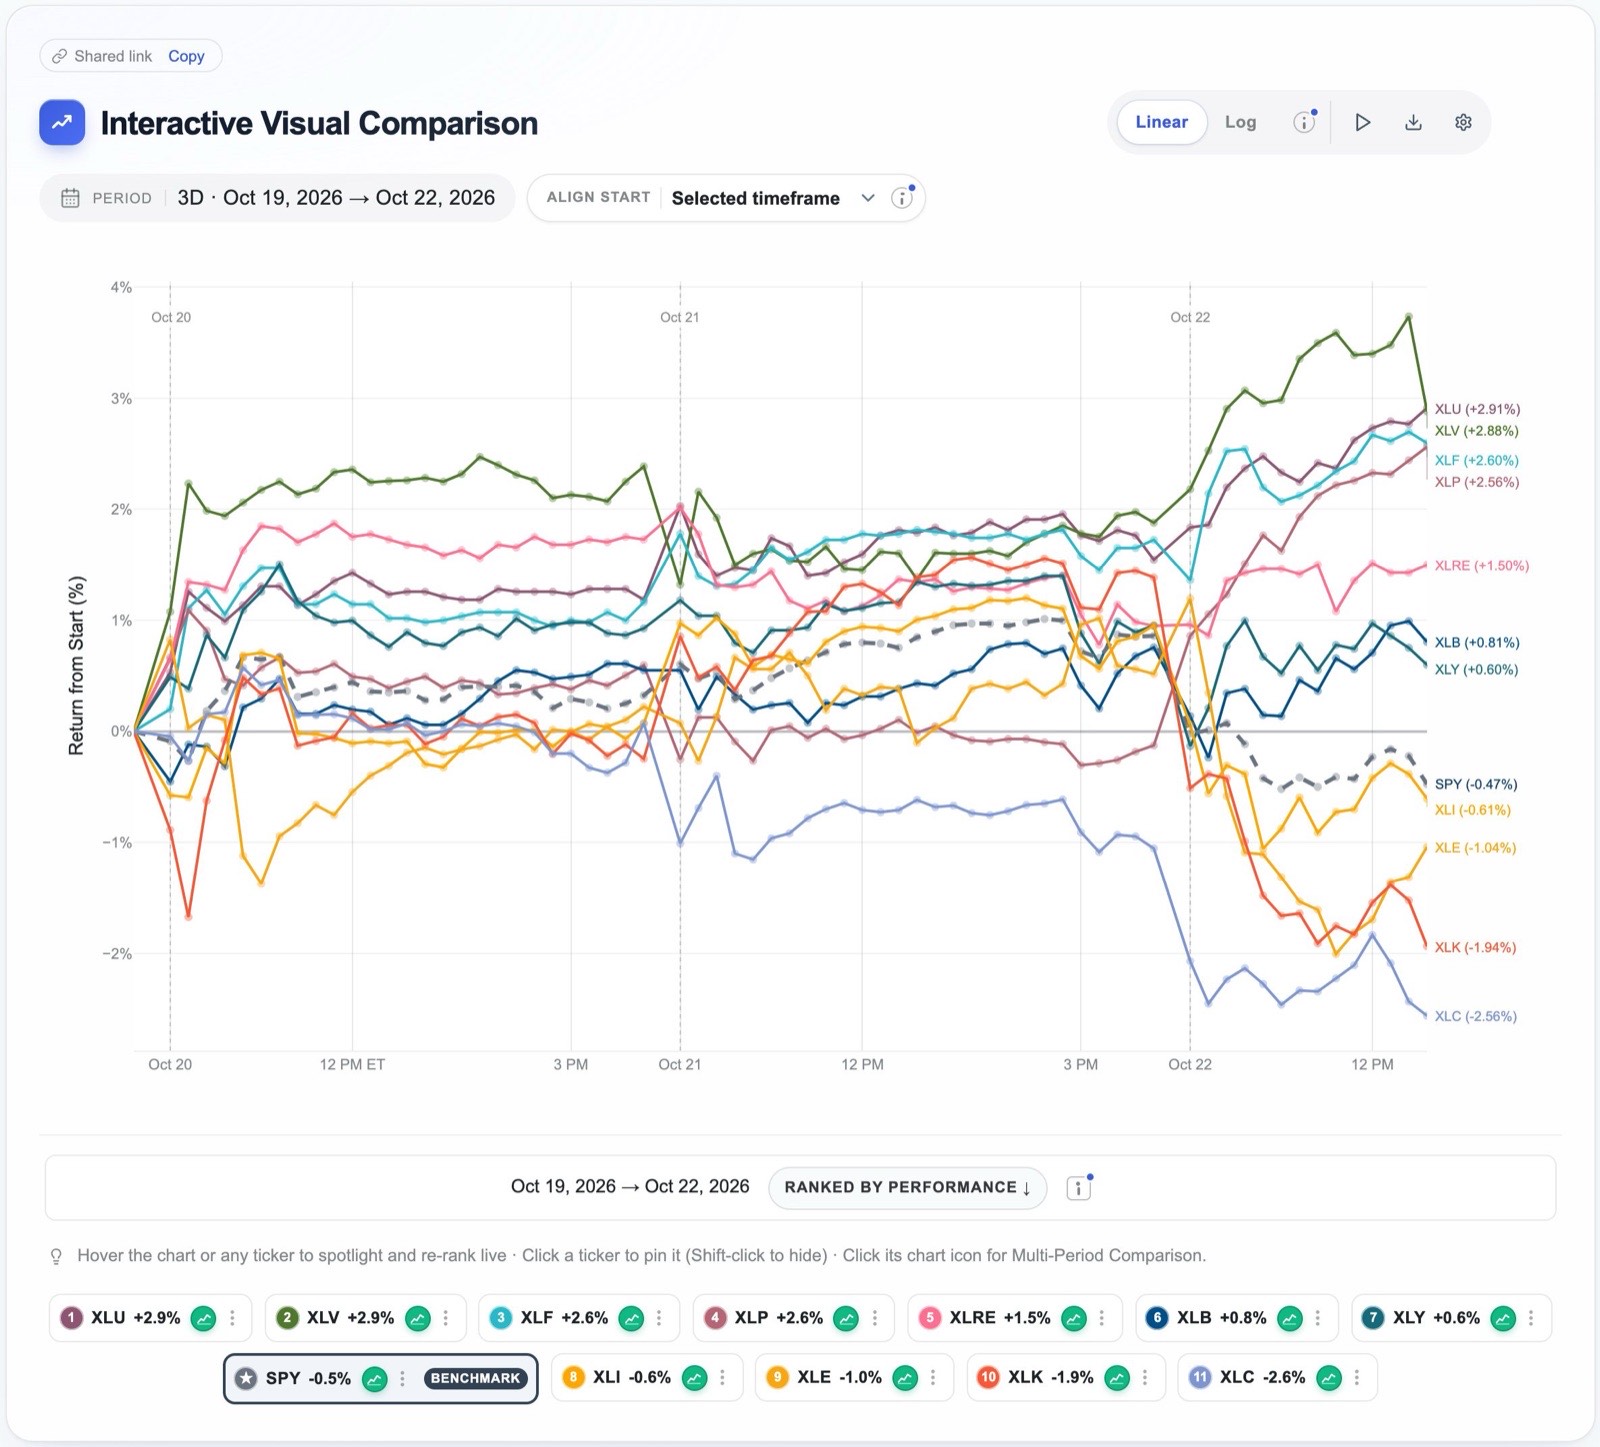
The screenshot records a small but instructive event. During the first two sessions the sector funds stayed within about three percentage points of one another, but shortly after the open on October 22 they separated sharply: technology and communication services fell, finishing the three days down 1.9% and 2.6%, while utilities, health care, financials and consumer staples rose by between 2.6% and 2.9%. SPY itself was down only 0.5%, so an investor watching the index alone would have seen a quiet morning, whereas the sector comparison reveals a rotation out of growth and into defensive sectors taking place within a single session.
When intraday comparison is useful
- On the day of an earnings report. Place the reporting company beside its closest competitors and its sector fund, for example NVIDIA with AMD, Broadcom and SMH, to see whether the market is rewarding or punishing that company alone or re-pricing the whole group.
- Around economic releases and central-bank decisions. Inflation figures, employment reports and Federal Reserve announcements affect interest-rate-sensitive groups first, so a list of banks, property funds, housebuilders, utilities and long Treasuries beside SPY shows which of them the news is moving and by how much.
- On days of sudden market stress. When markets fall sharply, an intraday comparison shows which holdings are holding up and which are breaking down as it happens, and the corresponding scenario test, such as the Liberation Day sell-off of April 2025, shows how the same holdings behaved in an earlier shock.
- To separate a company's news from the market's. A stock that falls 3% on a day when SPY also falls 3% has told you nothing about itself, whereas a stock that falls 3% while its sector rises has told you a great deal.
- To see rotation and overnight gaps. As the screenshot shows, the two-day and three-day views reveal money moving between sectors, and they also distinguish moves that happened overnight, between sessions, from those that developed during trading.
- Before placing an order. If you plan to buy an investment that has fallen today, a glance at its peers tells you whether you are buying a company-specific setback or simply a weak market.
For active traders
Traders who manage positions within the day will find the same view useful for watching relative strength, which is how each holding is performing against SPY as the session progresses, and for spotting divergences, such as a stock that keeps rising while its sector falls. Sweeping the cursor across the session shows exactly when leadership changed hands, the Show control keeps only the strongest and weakest names on a crowded chart, and a list of fifty names gives a quick sense of breadth, that is, whether a move is broad or carried by a few large stocks.
A word of caution
For long-term investors, most intraday movement is noise, and reacting to it is more likely to harm returns than to help them. Fifteen-minute bars are also a summary rather than a record of every trade, so the intraday view is meant for understanding what the market is doing, not for timing the execution of orders.
Your workspace
13Organising your work: lists, collections and presets
Comparison becomes a habit only when it is easy to return to, and EasyCompare is organised so that each question you are investigating can live in its own place with its own settings.
Comparison lists
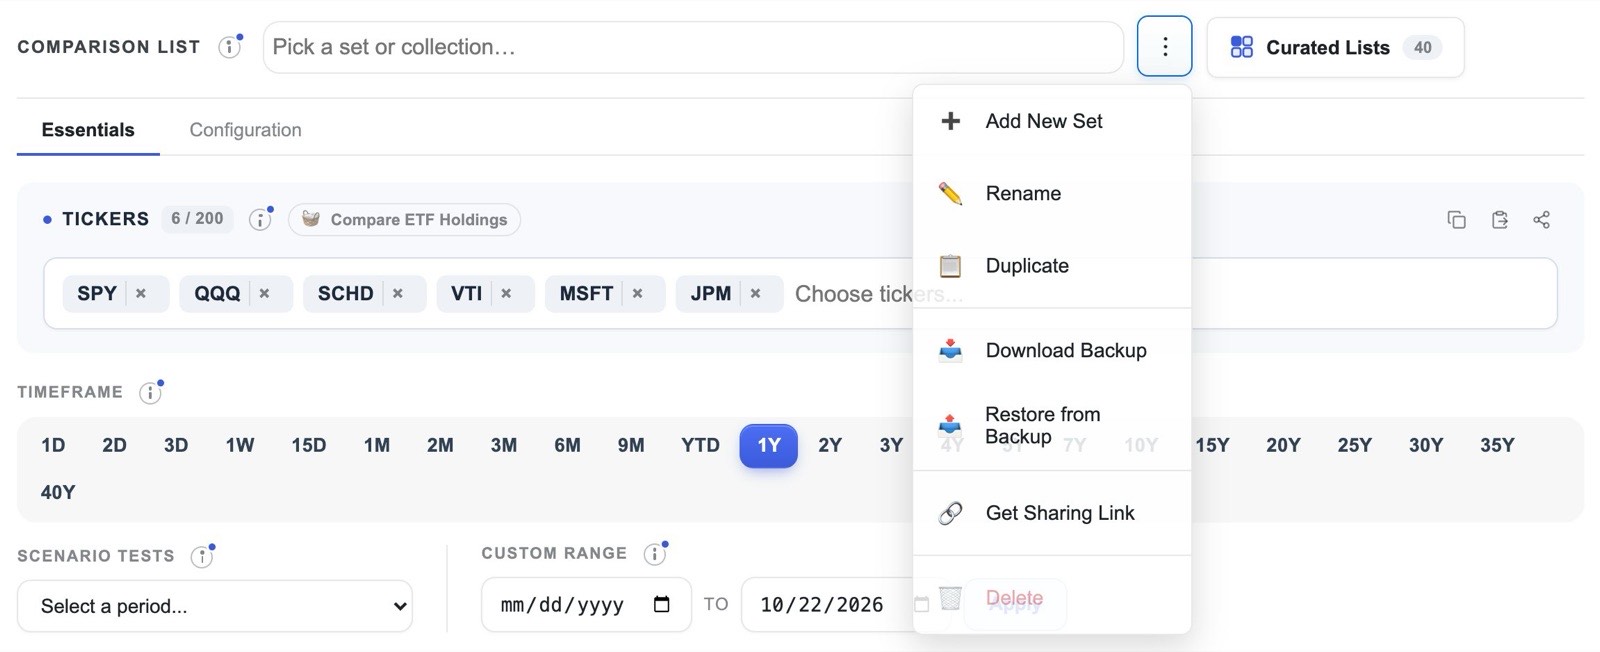
A comparison list holds a set of tickers together with the choices that belong to them: the benchmark, the periods shown in the multi-period columns, and the columns you have hidden or reordered in the rankings table. It is sensible to keep one list for each question, such as one for your current holdings, one for a replacement you are considering, and one for a theme you are watching. The menu beside the list name lets you add a new list, rename or duplicate one, download a backup or restore from one, and copy a sharing link. Pressing the / key opens a quick switcher that finds any list by name, with the most recently used lists at the top. The free plan includes one saved list, and Pro removes the limit.
Curated lists
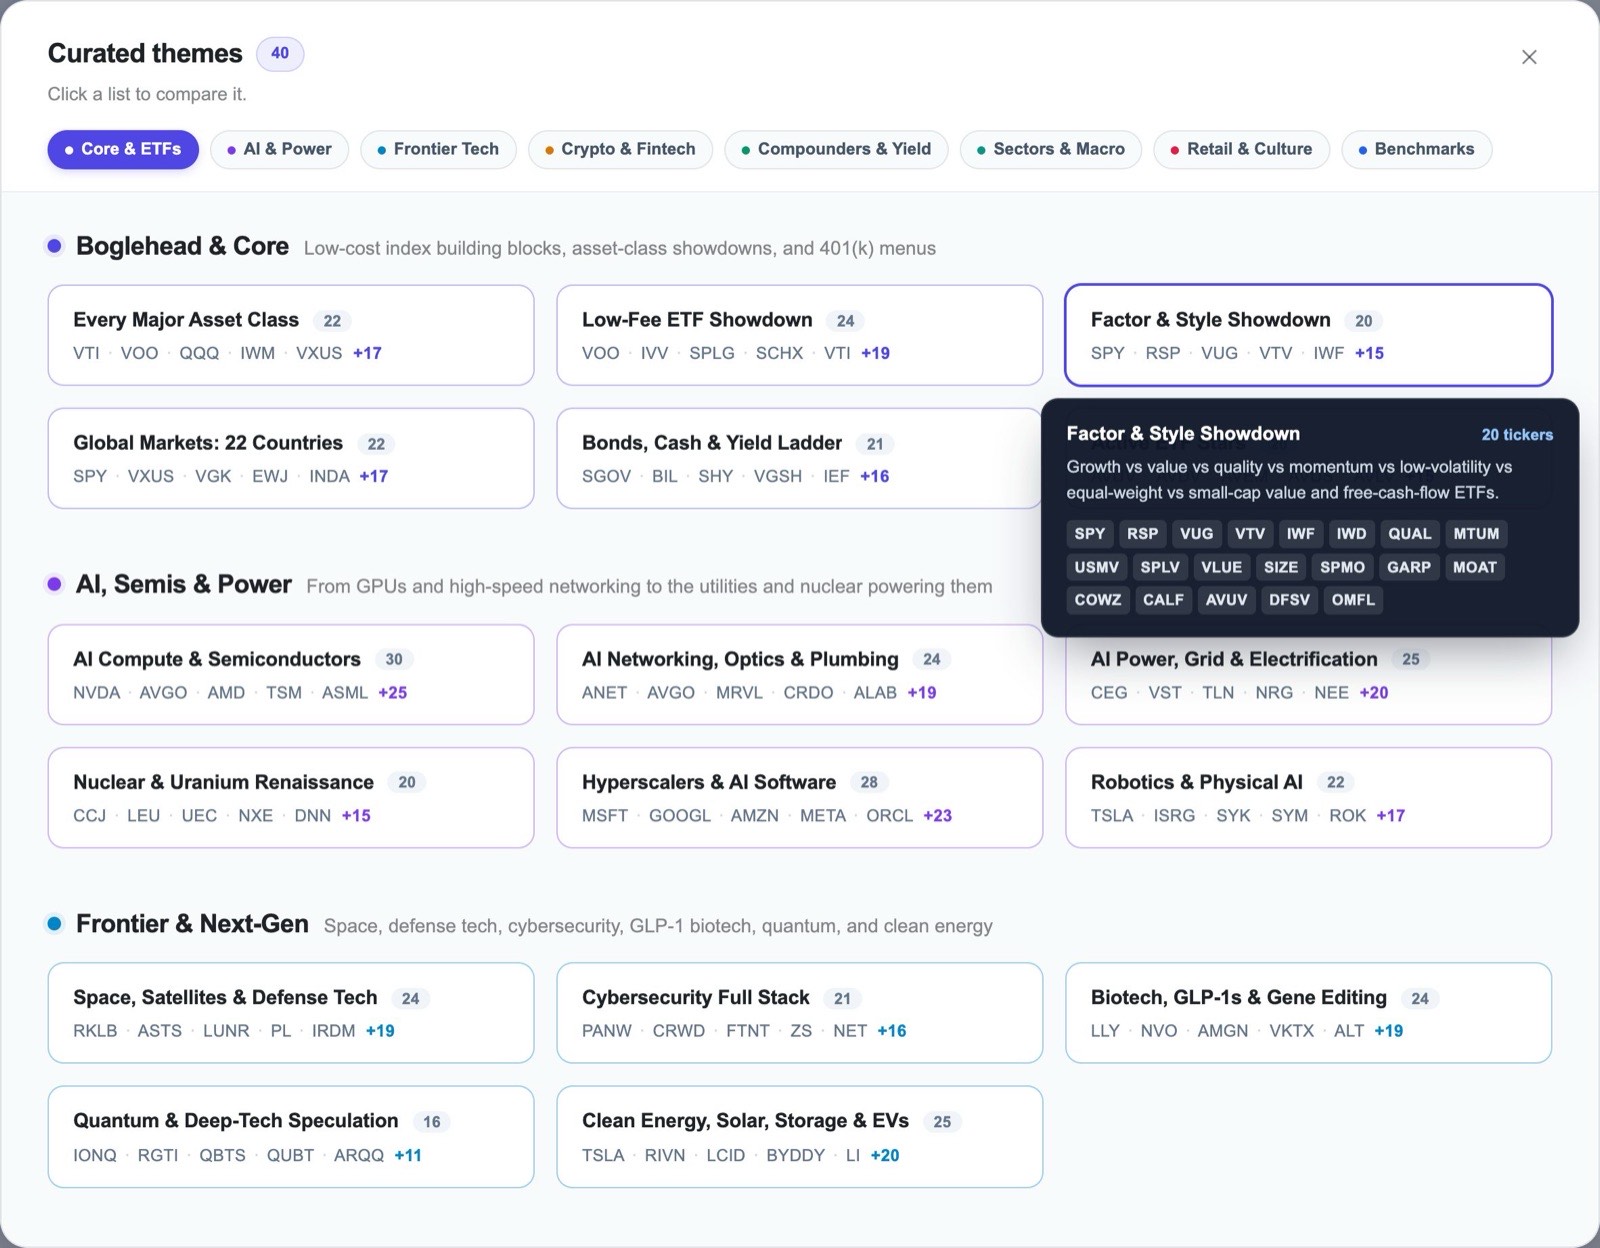
A blank search box is a poor place to begin, so EasyCompare includes forty curated lists, grouped into themes such as core ETFs, AI and power, frontier technology, compounders and yield, sectors and macro, and the major benchmarks. They range from Every Major Asset Class and the Low-Fee ETF Showdown to the Dow Jones 30 and the S&P 500 Top 100. Curated lists open as read-only views, so exploring one never alters your own lists, and saving one creates a copy that you can then change freely.
Presets as reusable lenses
The timeframe buttons, the scenario tests and the custom range are best thought of as lenses that you can apply to any list. A useful routine is to look at a new list first over one year, then over five, then through one crisis scenario, and finally in the rank heatmap, because those four views together cover most of the principles in this tutorial. The periods you choose for the multi-period columns are saved with each list, so that a list of long-term holdings can carry long periods while a trading list carries short ones.
Sharing and keeping your work
Every view has its own address. The Share button copies a link to the current list, and a short link of the form easycompare.io/t/VOO,QQQ,SCHD opens any set of tickers directly, which makes it simple to send a comparison to someone else, who needs no account to view it. The chart can be exported as an image, and signing in keeps your lists synchronised across all your devices. Whenever a metric is unfamiliar, the small information icon beside it opens an explanation, and The Non-Math Quant Guide treats each idea at greater length.
14Putting it together: six worked routines
The principles above are most useful when they are combined into routines for the decisions that investors actually face. Each of the following routines draws on several sections of this tutorial.
Deciding whether to add a holding
Put the candidate in a list with what you already own and the alternatives you would otherwise buy. Read the rank heatmap for consistency, open the matchup against your largest holding, and finish with the drawdown and correlation columns to see what the candidate would add to your risk and your diversification.
Try it with the running exampleReplacing an expensive or redundant fund
Compare the fund with cheaper alternatives that follow a similar strategy over three and five years. If their returns are nearly identical and their correlation with one another is close to 1, the cheaper fund is very likely the better long-term choice, because fees are the one part of future returns that is known in advance.
Try it with S&P 500 and total-market fundsJudging whether an ETF earns its place
Plot the ETF against its holdings and read the scorecard. A fund whose median holding trails it, and whose return rests on a few names, is giving you concentrated exposure in a diversified wrapper, and you should decide whether that is what you want.
Try it with SMHStress-testing a list
Run your list through at least two scenario tests of different character, such as the 2022 bear market and the COVID crash, and compare each holding's drawdown with the fall you have decided you could tolerate. Pay particular attention to any holding you were relying on for protection.
Try it with the major asset classesPreparing for an earnings day
Before the report, build a list of the company, its three or four closest competitors, its sector fund and SPY. On the day, use the one-day view to see whether the reaction is confined to the company or shared by the group, and sweep the session to see when it began.
Try it with semiconductorsFrom discovery to decision
Use BetterThanSPY to find the funds that beat your benchmark most consistently across the whole market, then bring the most promising few into EasyCompare to examine their risk, their behaviour in crises and their holdings before making any decision.
Read the BetterThanSPY tutorial15What comparison cannot tell you
Careful comparison improves decisions, but it has limits that are worth stating plainly.
- The past does not determine the future. Every figure in EasyCompare describes what has already happened. Consistency across many periods is stronger evidence than a single good year, but it remains evidence about the past, and markets change.
- Lists chosen today contain survivors. A list of today's largest companies, or of funds that still exist, leaves out those that shrank or closed, so it makes the past look kinder than it was. This applies to several curated lists, including the S&P 500 Top 50 used in section 2.
- Returns are before taxes and trading costs. Fund returns are measured after each fund's own fees, but they do not reflect taxes on dividends or gains, or the cost of buying and selling, both of which reduce what an investor actually keeps.
- Data occasionally contains errors. Dividend records from data providers are sometimes late or mis-scaled, and newly listed investments have short histories. Where a figure looks surprising, it is worth checking against a second source.
- This is not investment advice. EasyCompare is a tool for understanding how investments have behaved relative to one another. Decisions about your own money should take account of your goals, your time horizon and your circumstances.
16Glossary
- Benchmark
- The investment against which the others in a list are measured, often SPY. Each list may have its own benchmark.
- Total return
- The gain or loss over a period with every dividend reinvested on its payment date. EasyCompare uses total return throughout.
- CAGR
- Compound annual growth rate: the constant yearly return that would have produced the same overall result.
- Volatility
- How widely returns vary, expressed as an annual percentage. Lower values indicate a smoother ride.
- Maximum drawdown
- The largest fall from a peak to a later low within the period.
- Current drawdown
- How far an investment stands today below its highest point in the period.
- Sharpe ratio
- Return above a risk-free rate divided by volatility: the reward earned for each unit of risk.
- ATH trend
- The recency-weighted balance between new period highs and new period lows, from −1 to +1. Higher values describe a steadier advance.
- SPY correlation
- How closely daily movements have followed the S&P 500, from −1 to +1. Lower values indicate greater diversification.
- Average rank
- The mean of an investment's ranks across the selected periods in the rank heatmap. Lower is better.
- Scenario test
- A historical episode, such as a crash or a bull market, applied to the chart and table with its exact dates.
- Opportunity cost
- The return given up by choosing one investment rather than the best available alternative.
The best way to learn comparison is to practise it on a decision you actually face.
Open EasyCompare