Chapter 2 of 9 · 6 min read
Understanding and Measuring Risk
How statistics turns future return uncertainty into a concrete number called Volatility, and why two investments with the exact same performance can demand very different capital allocations.
We all have an intuitive idea of what risk means: we associate risk with loss. Another way of looking at Risk is the amount of uncertainty of future returns, which we can estimate from an investment's past returns. Casinos pose a very high risk for most people since the odds of winning are highly random. Investing in a Savings Account or short-term Treasury Bills is low risk (close to zero) because the return is predictable and backed by institutions in a stable country.
Interestingly, this uncertainty can be expressed using the field of statistics through concepts like Volatility. Volatility refers to the bumpiness or fluctuations in returns. It is also termed the Standard Deviation of Returns if you are familiar with high school statistics. It is a foundational measure of risk which, while not perfect, gives us a strong relative sense of risk across different investments.
In general, the higher the volatility, the greater the fluctuation or uncertainty in returns. Investors should prefer lower volatility to higher volatility, unless the performance is correspondingly higher for the more volatile asset, which we will illustrate in Chapter 4.
Example: Same Performance, Twice the Volatility
The following example from real market history shows two investments that achieved the exact same 5-year performance (+123%), but with very different return paths and volatility. Note that this is always possible: for the exact same final performance, we can have an endless number of return combinations. Think about the implications of that. Many investors never do.

If you look at the price evolution and its bumpiness in Figure 2.1, Investment 2 is much more volatile than Investment 1 (nearly twice as volatile: 43.3% vs. 23.4%). In general, investors would prefer Investment 1 if you only want to invest in one. But there is room for both investments in a portfolio as long as we allocate our money accordingly.
One practical approach is to balance allocation according to risk and performance. In this case, since Investment 2 has roughly twice the volatility for the same performance, you may choose to allocate half the amount to Investment 2 as you allocate to Investment 1 as a rough heuristic. This is a great starting point, though other factors also come into play including your fundamental views and reward-to-risk profiles, which we will discuss in Chapter 4.
Volatility of Different Assets Varies Wildly
Volatility is one of the most important concepts you can understand in investing. You do not need to know how it is computed mathematically, but an intuitive sense of volatility will help you look at different investments in a completely new way. To cement this risk measurement, the chart and table below show the 5-year annualized volatilities of familiar investments across asset classes.
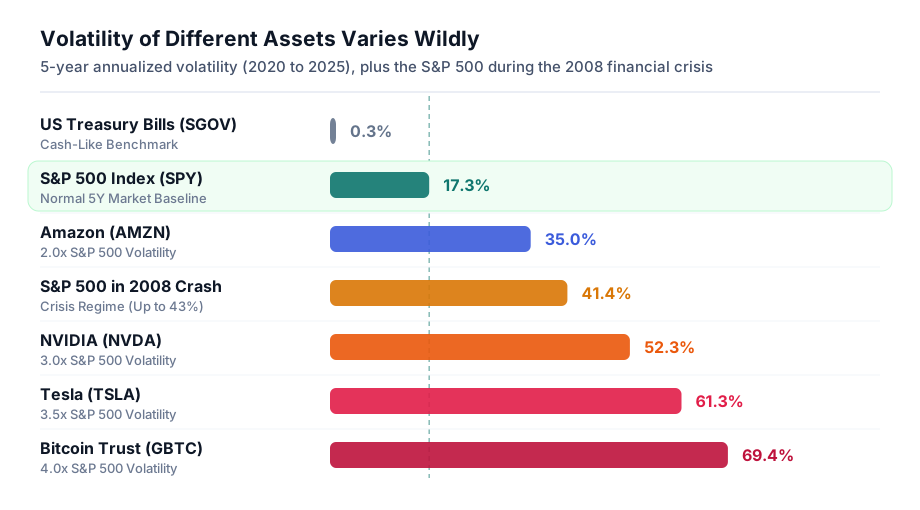
As you can see, volatilities vary widely, showing how much uncertainty differs across individual stocks and asset types. They can even rise above 100% (for example, 3x leveraged ETFs like SOXL had 105.3% annualized volatility over this same 5-year period, and Litecoin reached 116% in our 2018 edition). In fact, there is no upper limit to volatility, though it can never be infinite.
Cryptocurrencies and high-growth single stocks show remarkably higher levels of volatility compared to broad market indices, which aligns with everyday intuition. We recommend that you memorize a few of these benchmark volatilities so you always have a frame of reference in mind when evaluating any investment. The S&P 500's long-term average volatility (~13% to 17%) is especially useful as your baseline anchor. During the 2008 financial crisis, the S&P 500's volatility spiked all the way up to 41% to 43%1.
| Investment | Category | 5Y Volatility (2020–2025) | 2018 Edition (5Y) | Multiple of S&P 500 Risk |
|---|---|---|---|---|
| US Treasury Bills (SGOV) | Cash-Like Benchmark | 0.3% | ~0.2% | 0.02x (Near Zero) |
| S&P 500 Index (SPY) | US Stock Market Benchmark | 17.3% | 12.9% | 1.0x (Reference Anchor) |
| Amazon (AMZN) | Large-Cap Tech Stock | 35.0% | 30.4% | 2.0x S&P 500 |
| S&P 500 in 2008 Crisis | Market Crash Regime | 41.4% (up to 43%) | 43.0% | 2.4x Normal S&P 500 |
| NVIDIA (NVDA) | Semiconductor Growth Stock | 52.3% | 38.1% | 3.0x S&P 500 |
| Tesla (TSLA) | Volatile Single Stock | 61.3% | 44.3% | 3.5x S&P 500 |
| Bitcoin (GBTC / BTC) | Cryptocurrency | 69.4% | 77.0% | 4.0x to 6.0x S&P 500 |
How can you get an even more intuitive, everyday sense of volatility that is easy to remember and apply on the fly? The next chapter is devoted to that.