Chapter 1 of 9 · 4 min read
What is Performance and Returns?
Why the simplest number in investing is only the starting point, how returns compound over time, and where uncertainty enters the picture.
The rawest measure of performance (and a flawed one when used on its own, as we shall see later) is the percentage difference between the latest price and a historical price. Since everyone understands this calculation, we will not spend time covering it in isolation. However, the key thing to note is that this is just one available measure that most investors rely on because it is the simplest. And simplest does not always mean the best.
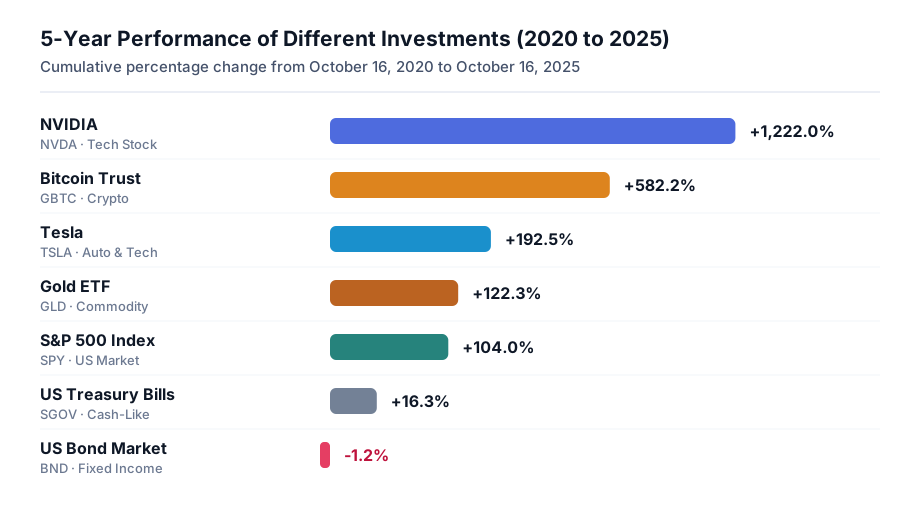
Below is a 5-year performance chart comparing major stocks, the S&P 500 index, Gold, US Treasury Bonds, and Bitcoin (from October 2020 to October 2025). You will notice that assets like NVIDIA or Bitcoin delivered extremely high cumulative performance. Even so, prudent investors do not pour all of their money into those assets relative to other investments (even assuming we cannot predict future winners in advance). Why is that the case? This is where Risk obviously comes in, as we will discuss in Chapter 2.
Returns and the Power of Compounding
Return is an essential building block for understanding Risk and every other concept in this guide. It is the standard term used to denote the performance of a specific time period. For example, a daily return means the percentage change in price over the previous day, and an annual return means the percentage change over a year. We can combine multiple periodic returns over a time horizon to get the final cumulative performance.
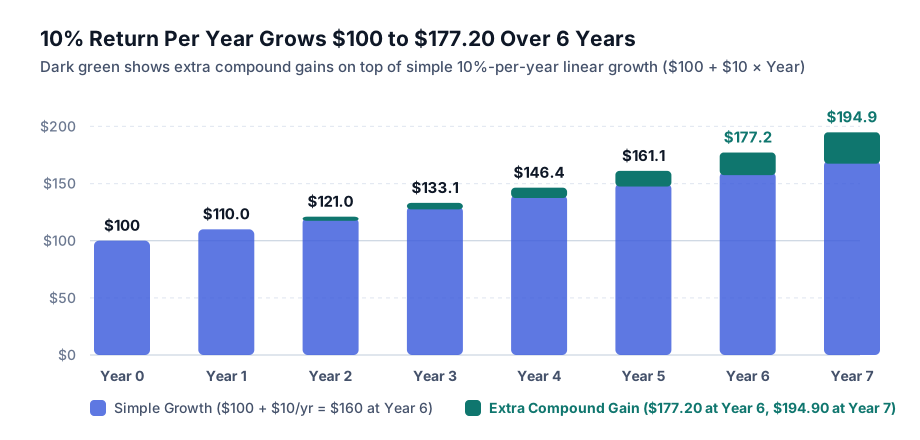
The chart below shows how an investment grows over time if we earn a steady 10% return per year: starting from $100, our investment grows to $177.20 over 6 years (and $194.90 over 7 years) thanks to compounding, instead of just $160 (6 × 10% = +$60) under simple linear growth.
Daily Returns and the Emergence of Uncertainty
In real markets, returns are most commonly tracked day over day as Daily Returns. When we record them across a week of trading, we get a sequence of daily percentage changes like this:
It is hard to detect any predictable pattern in most such daily series, and looking at those day-to-day swings immediately gives us a sense of uncertainty about the nature of future returns. How wide are those fluctuations, and how do we measure that uncertainty so we can compare any two investments fairly? That leads directly to Chapter 2.