Press kit
EasyCompare for Mac
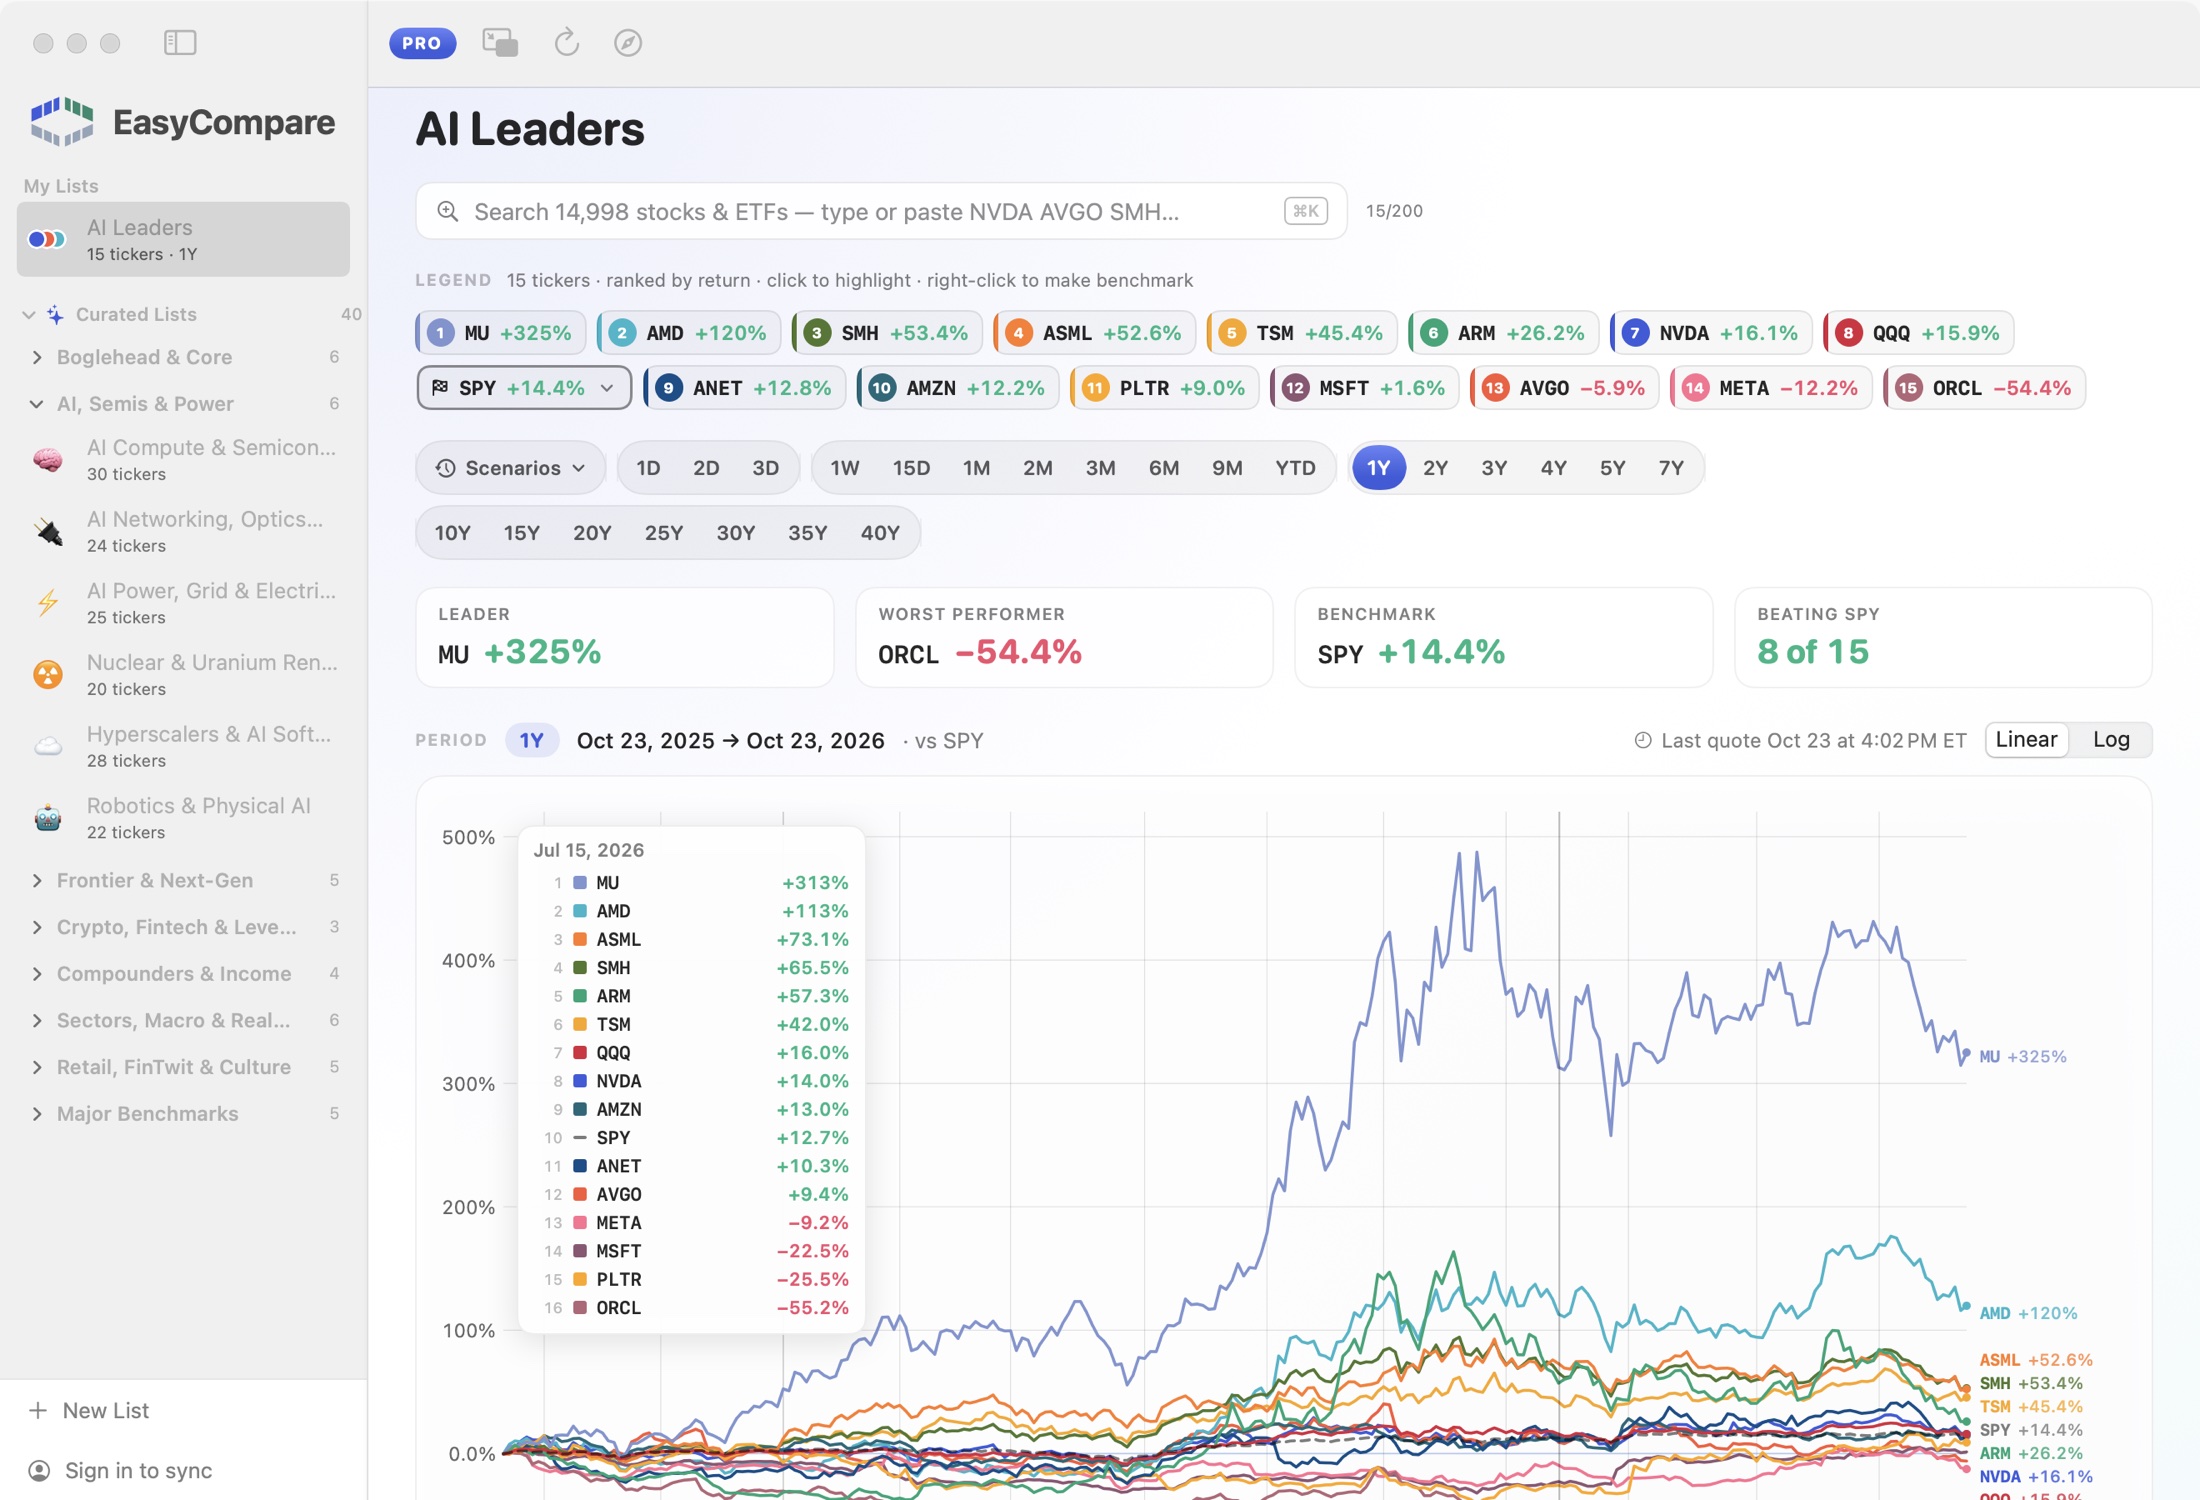
A focused comparison and relative intelligence platform for the Mac. EasyCompare brings your holdings, watchlists and new ideas into one live, deeply interactive comparison: up to 200 stocks, ETFs and funds at once, measured against a benchmark across every horizon and historic market scenario, with hedge-fund-level insights on risk, returns and drawdowns. It is built to counter short-term bias, FOMO and speculation by showing every choice next to its real alternatives.
Full tour See every feature, with screenshots, on the EasyCompare for Mac pageFact sheet
- Developer
- Ashish Gupta, QuantCommons
- Release
- Version 1.1, October 2026
- Platform
- macOS 14 Sonoma or later, Apple silicon and Intel
- Price
- Free; Pro unlocks 200 tickers per list, 40 years of history and intraday. One Pro plan covers Mac and web. Current pricing
- Download
- easycompare.io/mac
- Built with
- Native SwiftUI with GPU-drawn charts, on an in-memory Go engine holding 53 million prices
- Press contact
- [email protected]
About the developer
Ashish Gupta built hedging and risk systems for equity options at D.E. Shaw, then led machine learning for Google's Search Ads auctions, where his team's work became Smart Bidding. He holds a PhD in computer science from Northwestern and a B.Tech from IIT Delhi. EasyCompare is part of QuantCommons, his initiative to make the quantitative risk thinking of Wall Street accessible to everyday investors. ashishgup.com
Reviewers can request a free Pro code by emailing [email protected].
What makes it different
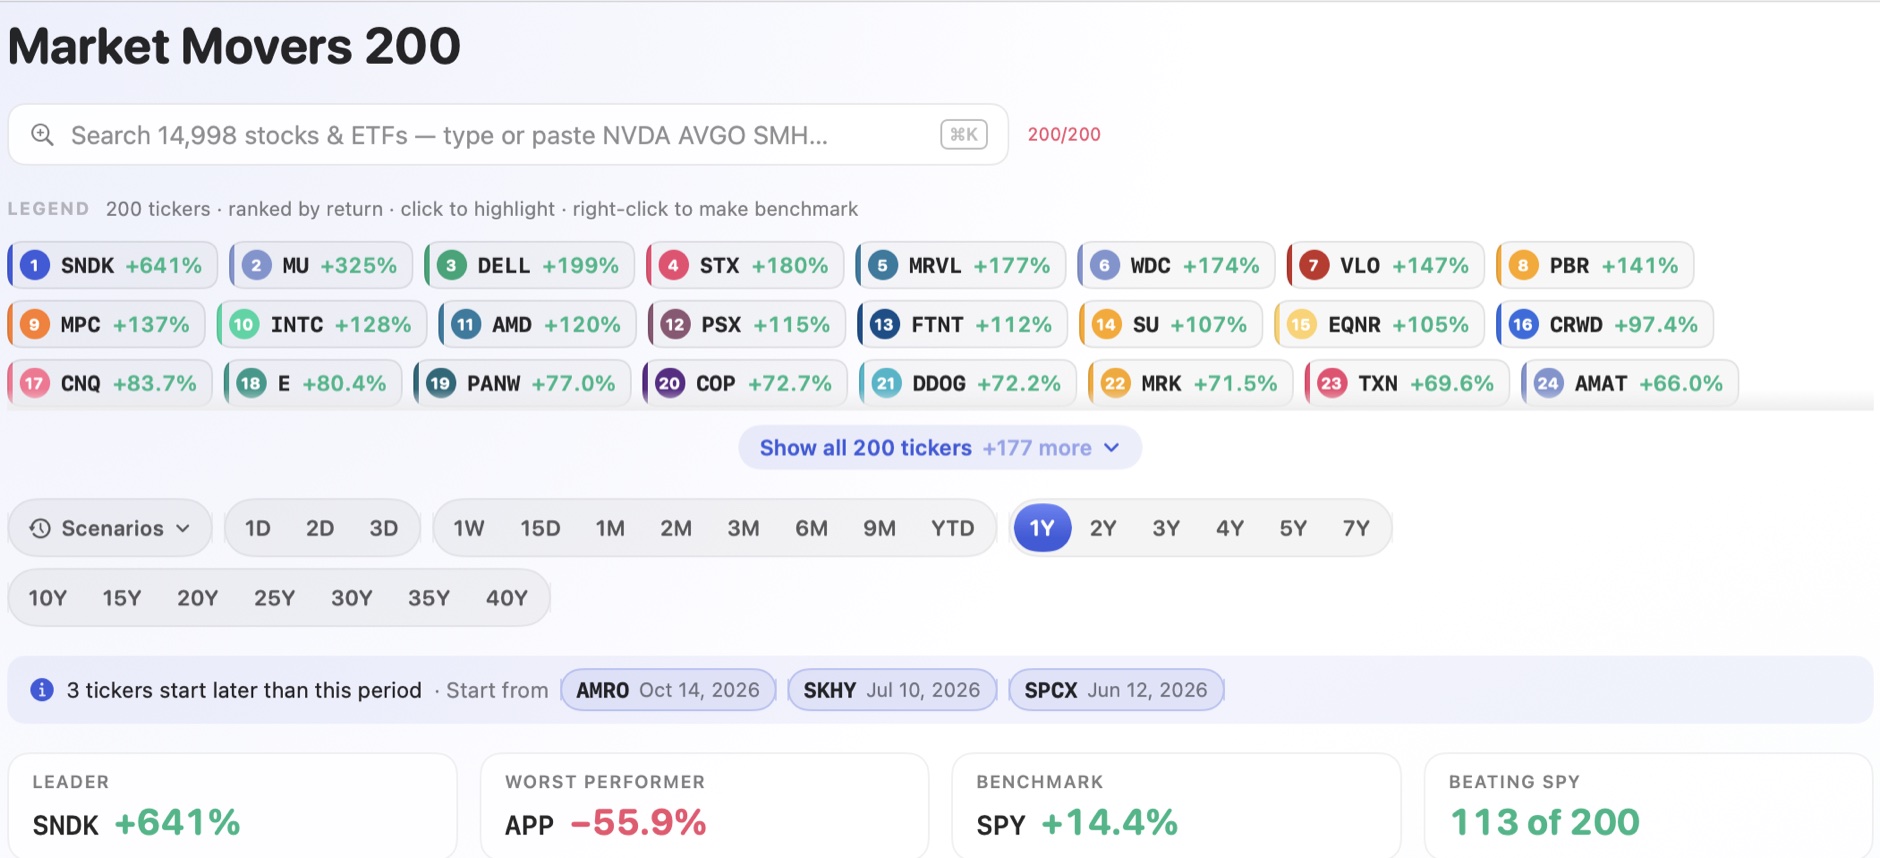
- Relative intelligence, not single-ticker charting. Holdings, watchlists and ideas become lists of alternatives: up to 200 stocks, ETFs and funds per list, unlimited lists, and 40 curated lists from broad ETFs to themes like AI and hyperscalers.
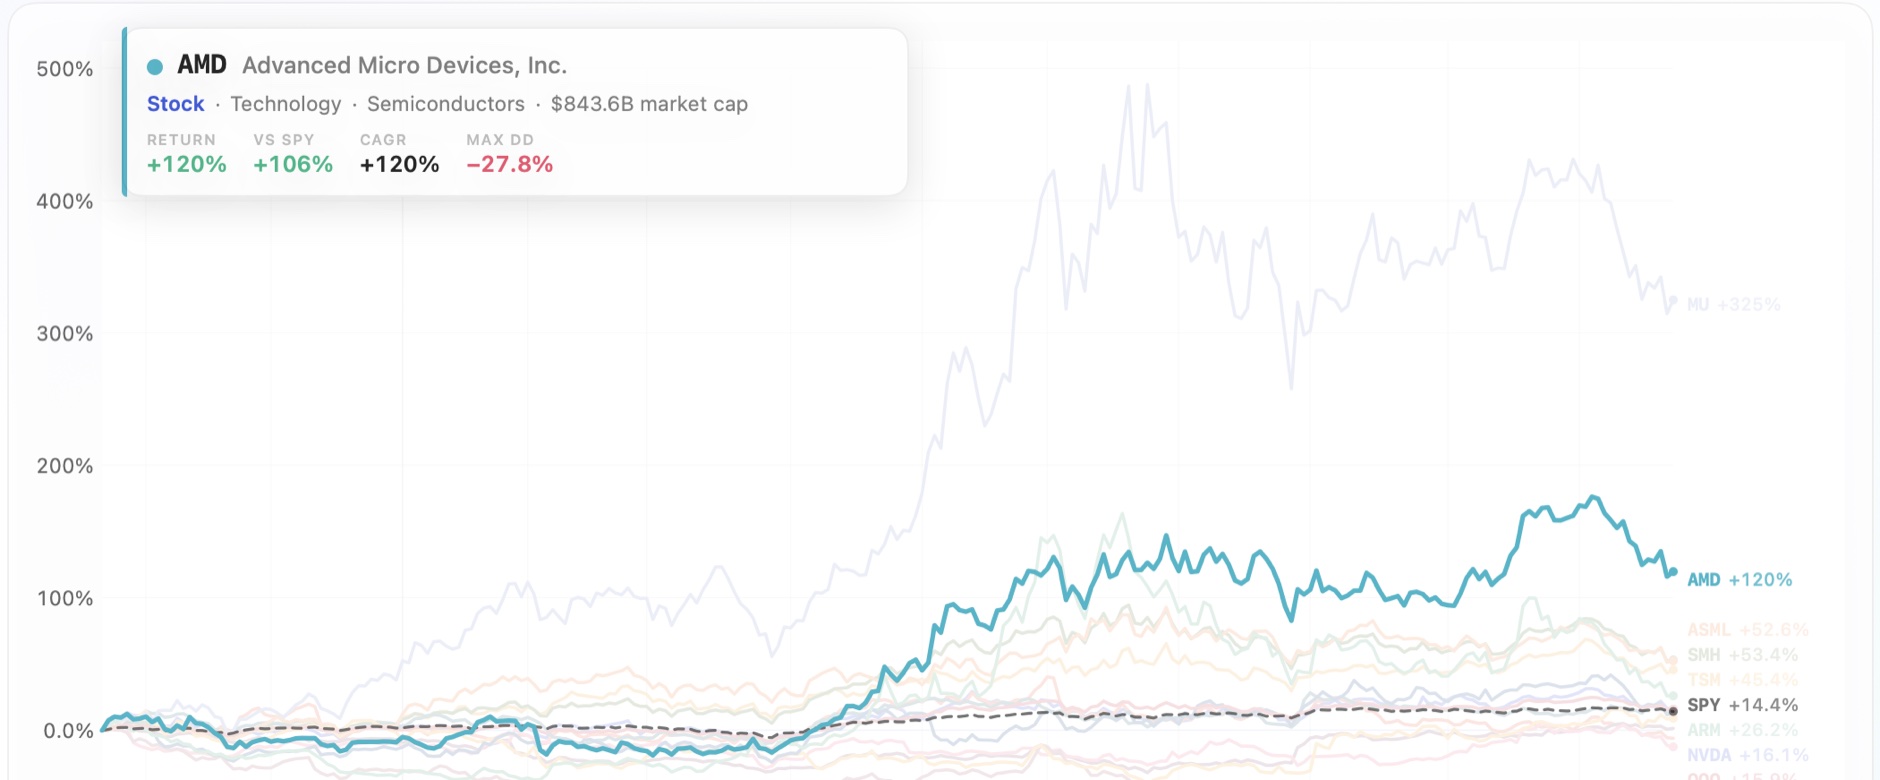
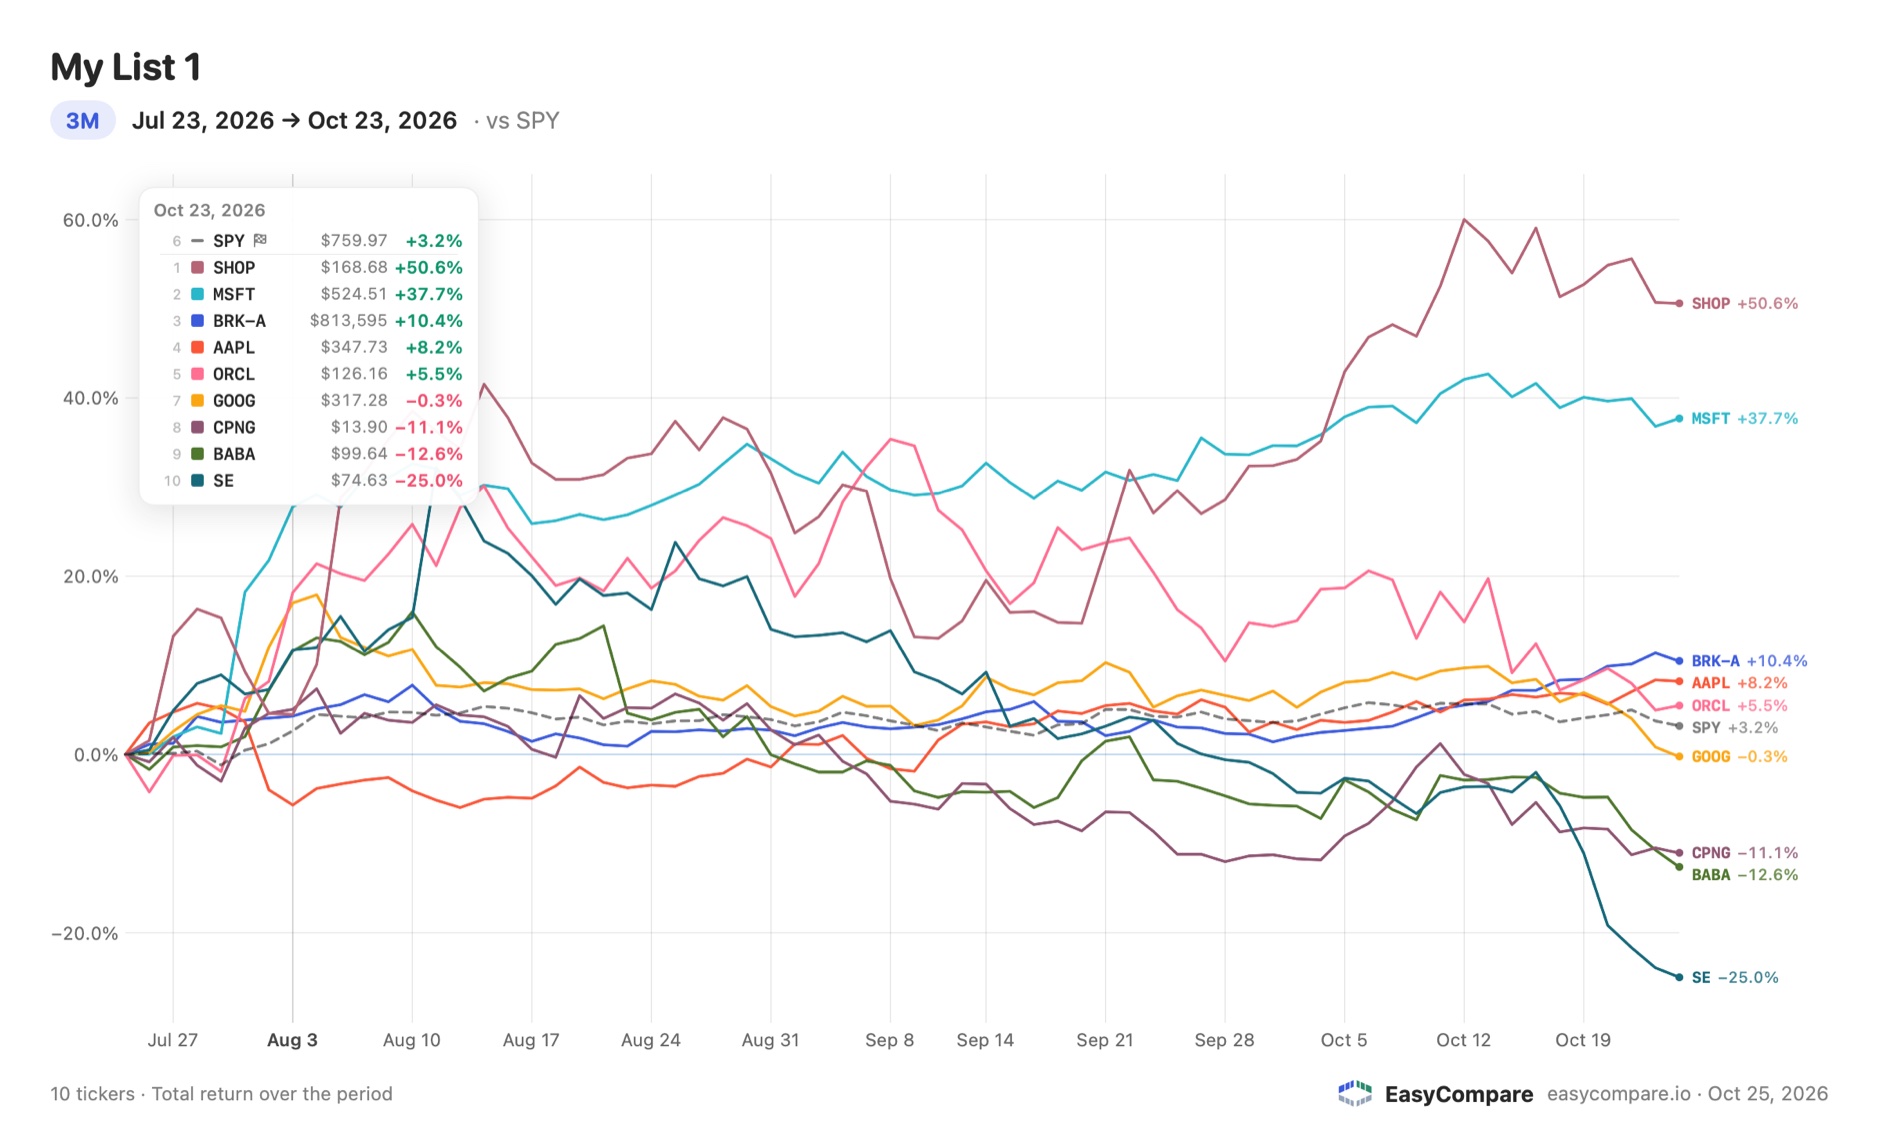
- A deeply interactive visual surface. Hover any line to bring it forward without losing the rest, scrub a ranked crosshair across any day or 15-minute bar, pin highlights, and hover a ticker for an info card with its sector, market cap and key metrics. Closed-market gaps are removed and long periods use a log scale, so every move reads true.
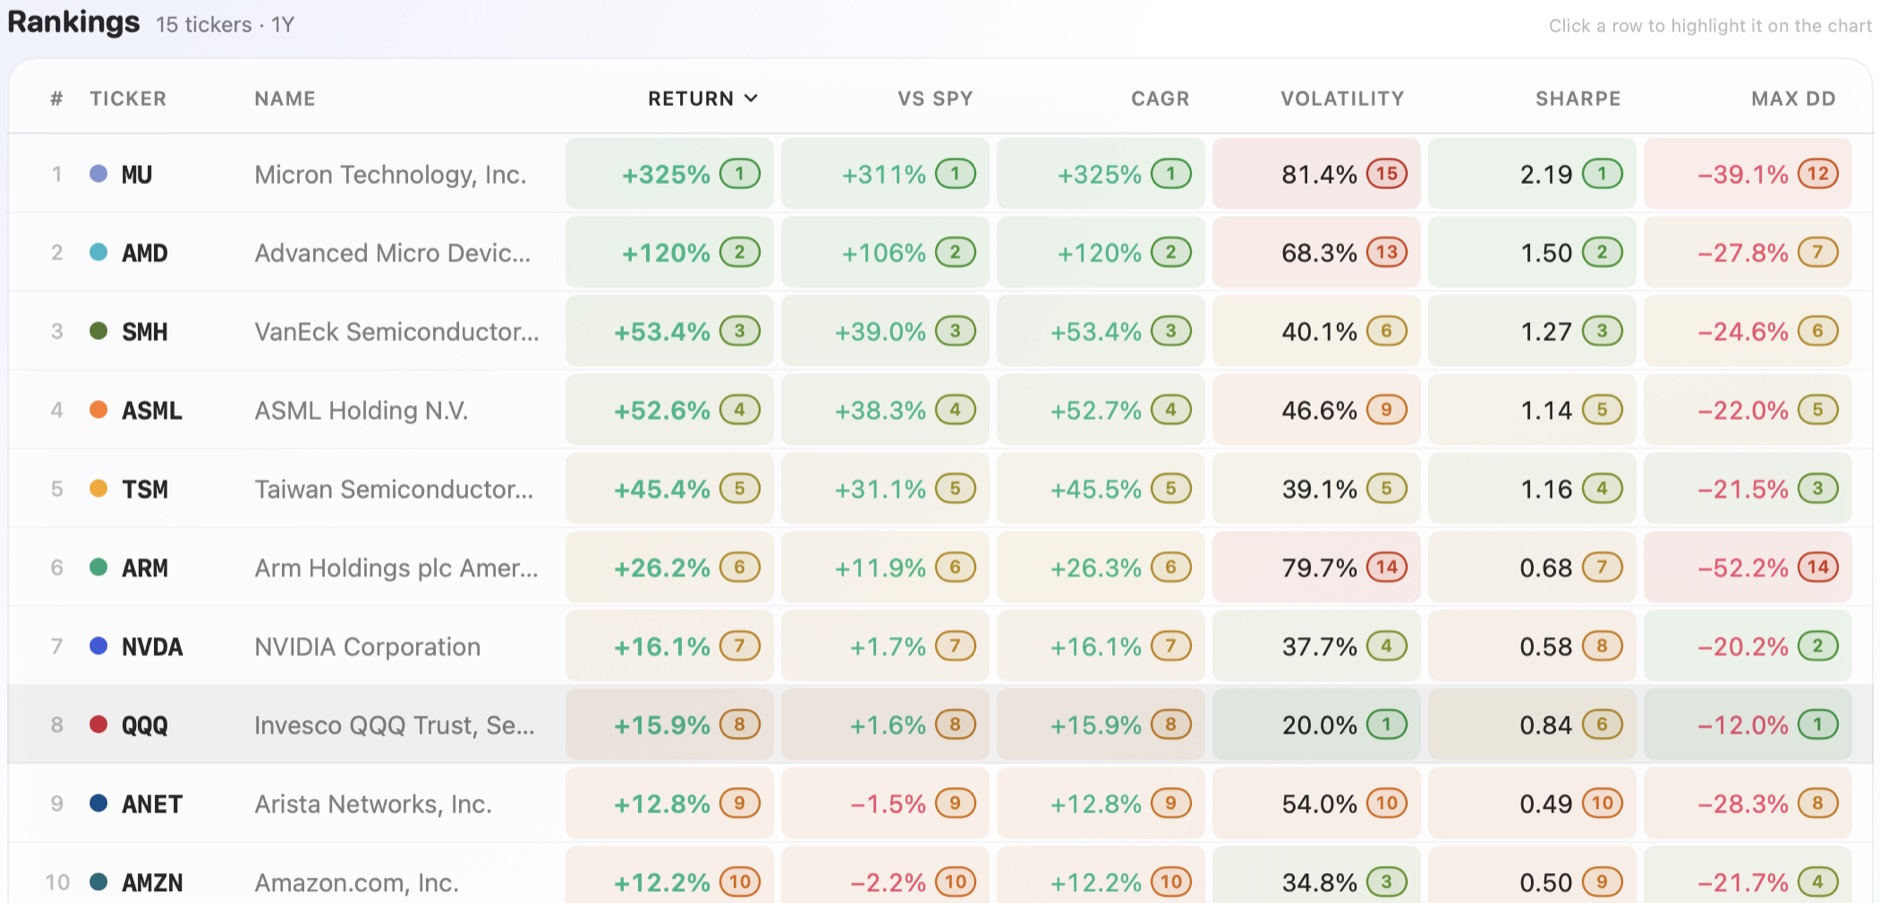
- Hedge-fund-level quantitative insight. Return, vs benchmark, CAGR, volatility, Sharpe ratio and max drawdown, color-ranked with rank badges, so risk is judged alongside return.
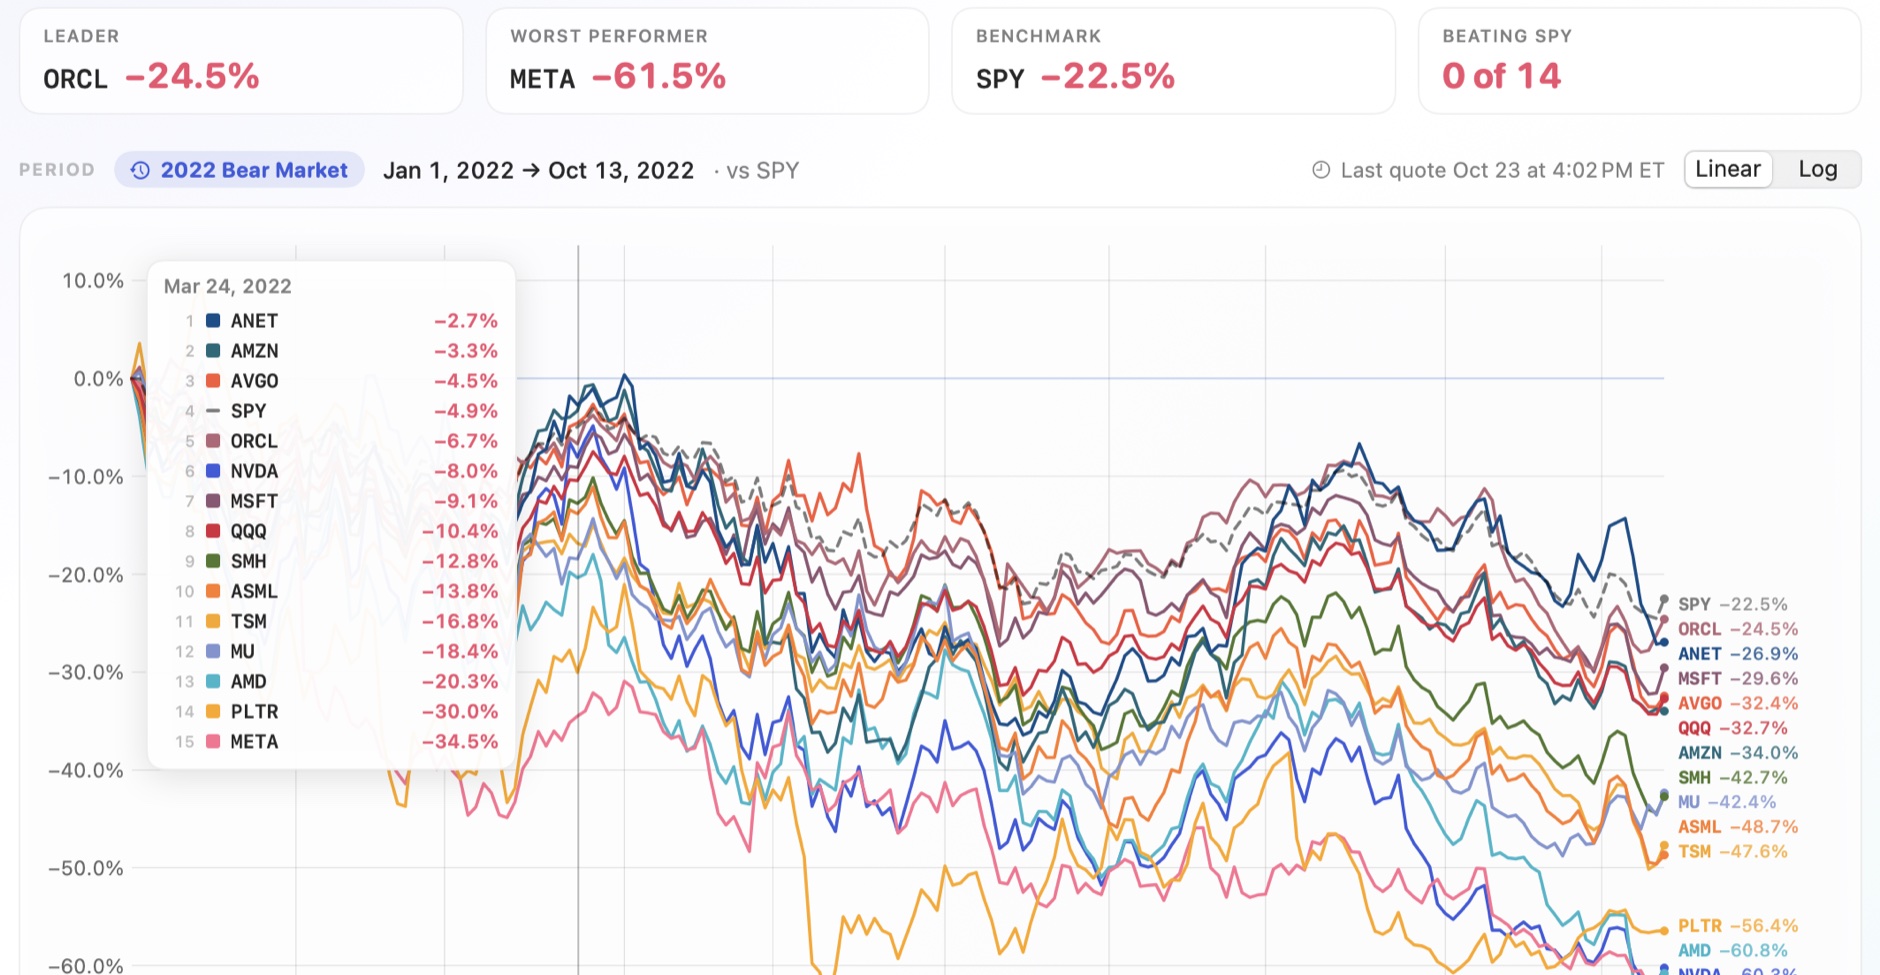
- Benchmark first. Every list is measured against a benchmark, with the leader, the laggard and the number beating it summarized for every period. Right-click any ticker to make it the benchmark.
- Every horizon and historic scenario. One click switches from today's session to forty years, or replays 20 curated crashes and bull markets, from the 1998 LTCM crisis to the AI boom.
- Discovery built in. Related-ticker suggestions, each with the reason it's related, show what to compare next.
- Fair comparisons by default. When a ticker started trading after the period begins, EasyCompare offers to start everything from its first day, so every line covers the same dates.
- Speed at 200 tickers. An in-memory Go engine recomputes every metric for every ticker on each change, typically in about 40 milliseconds, and the native app draws on the GPU.
- Designed against investing biases. Short-term bias, FOMO, pundit-following and judging in isolation are comparison mistakes, so every choice is shown next to its alternatives.
Screenshots
Full-resolution images. Click to open, then save. Free to use in coverage of EasyCompare.
Icon
 App icon, 512 × 512 PNG