01
Rankings
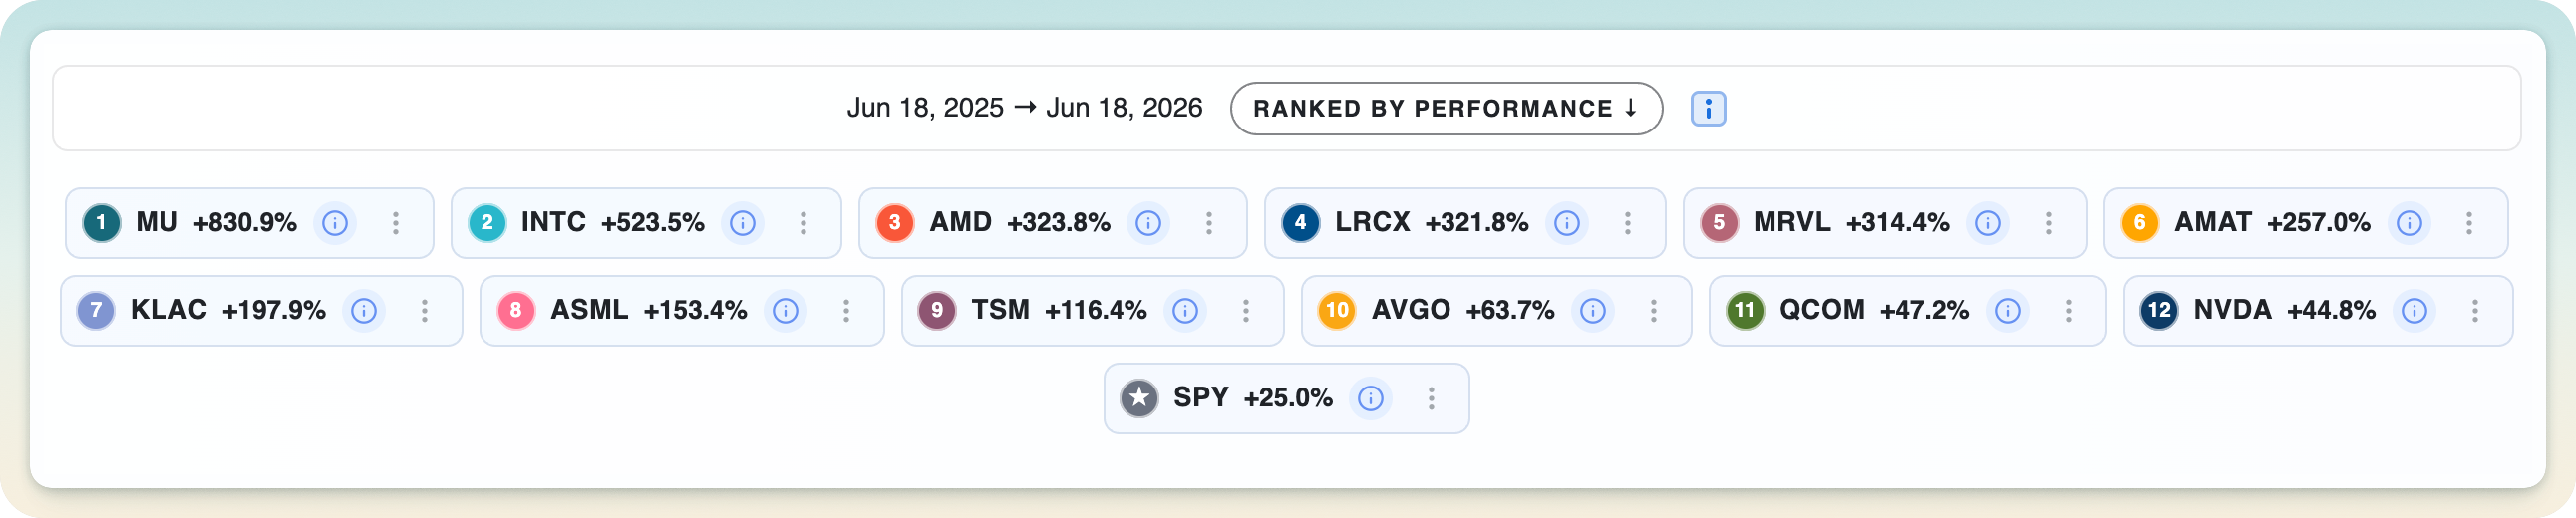
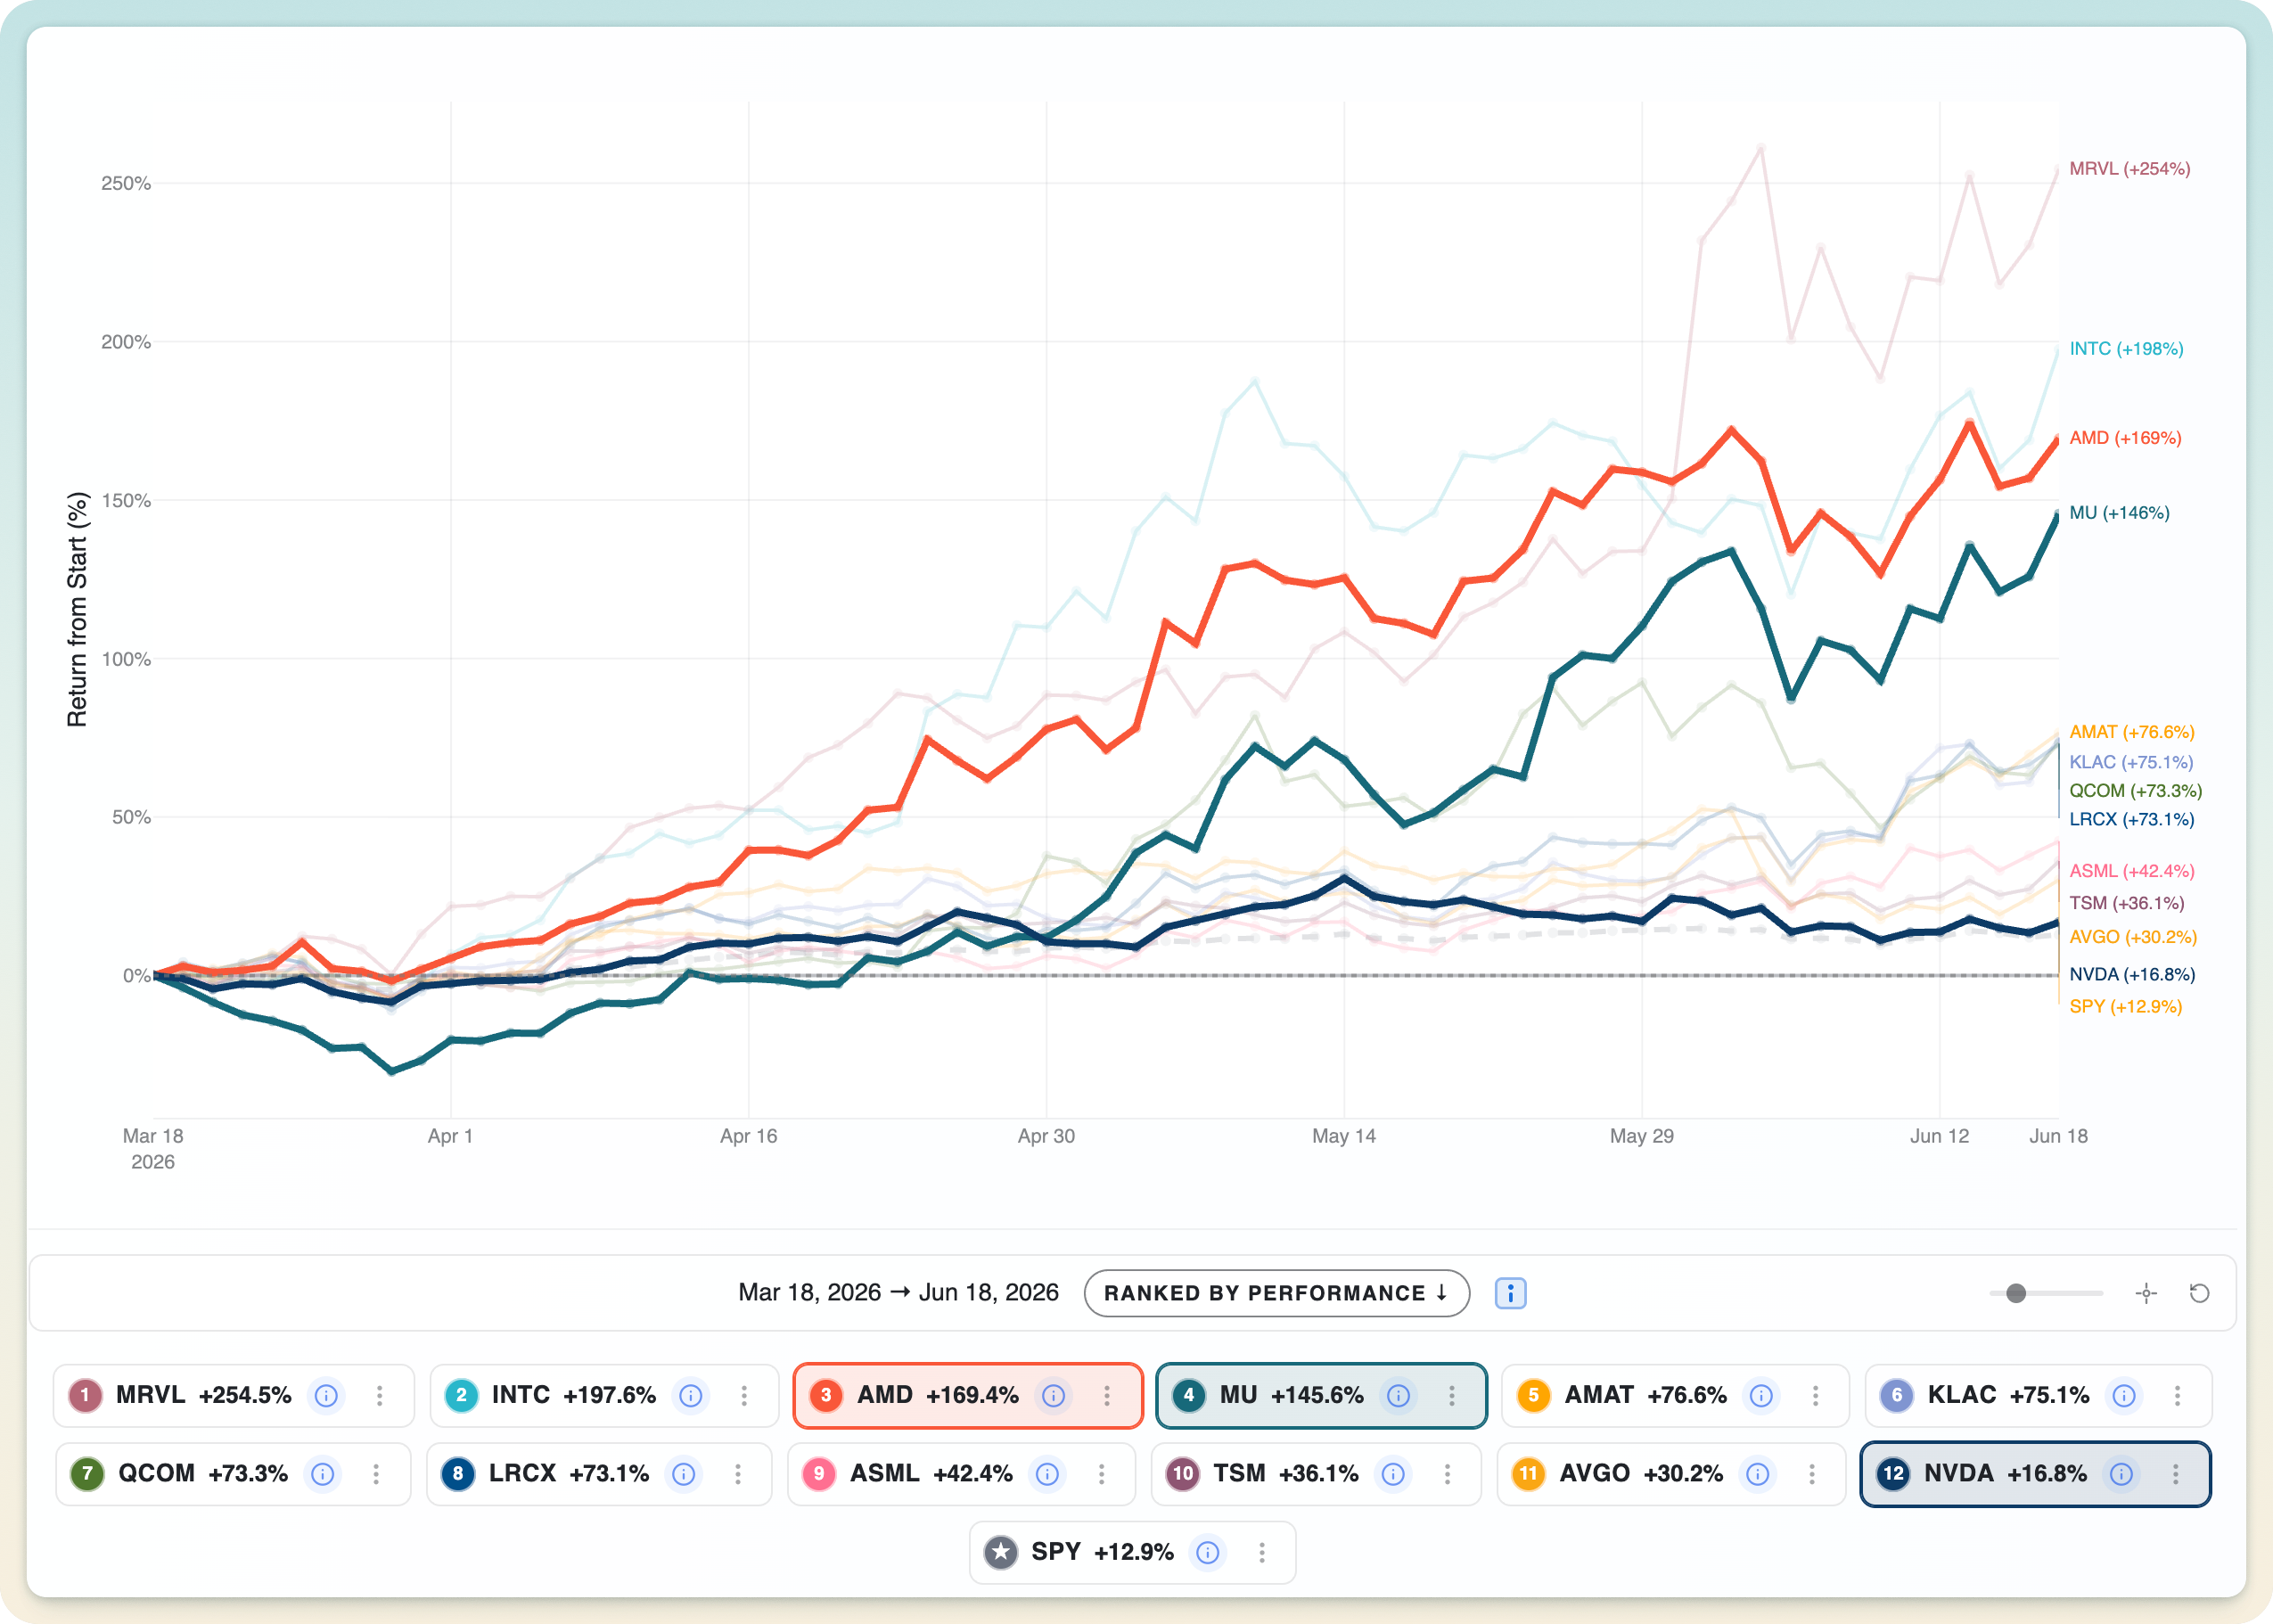
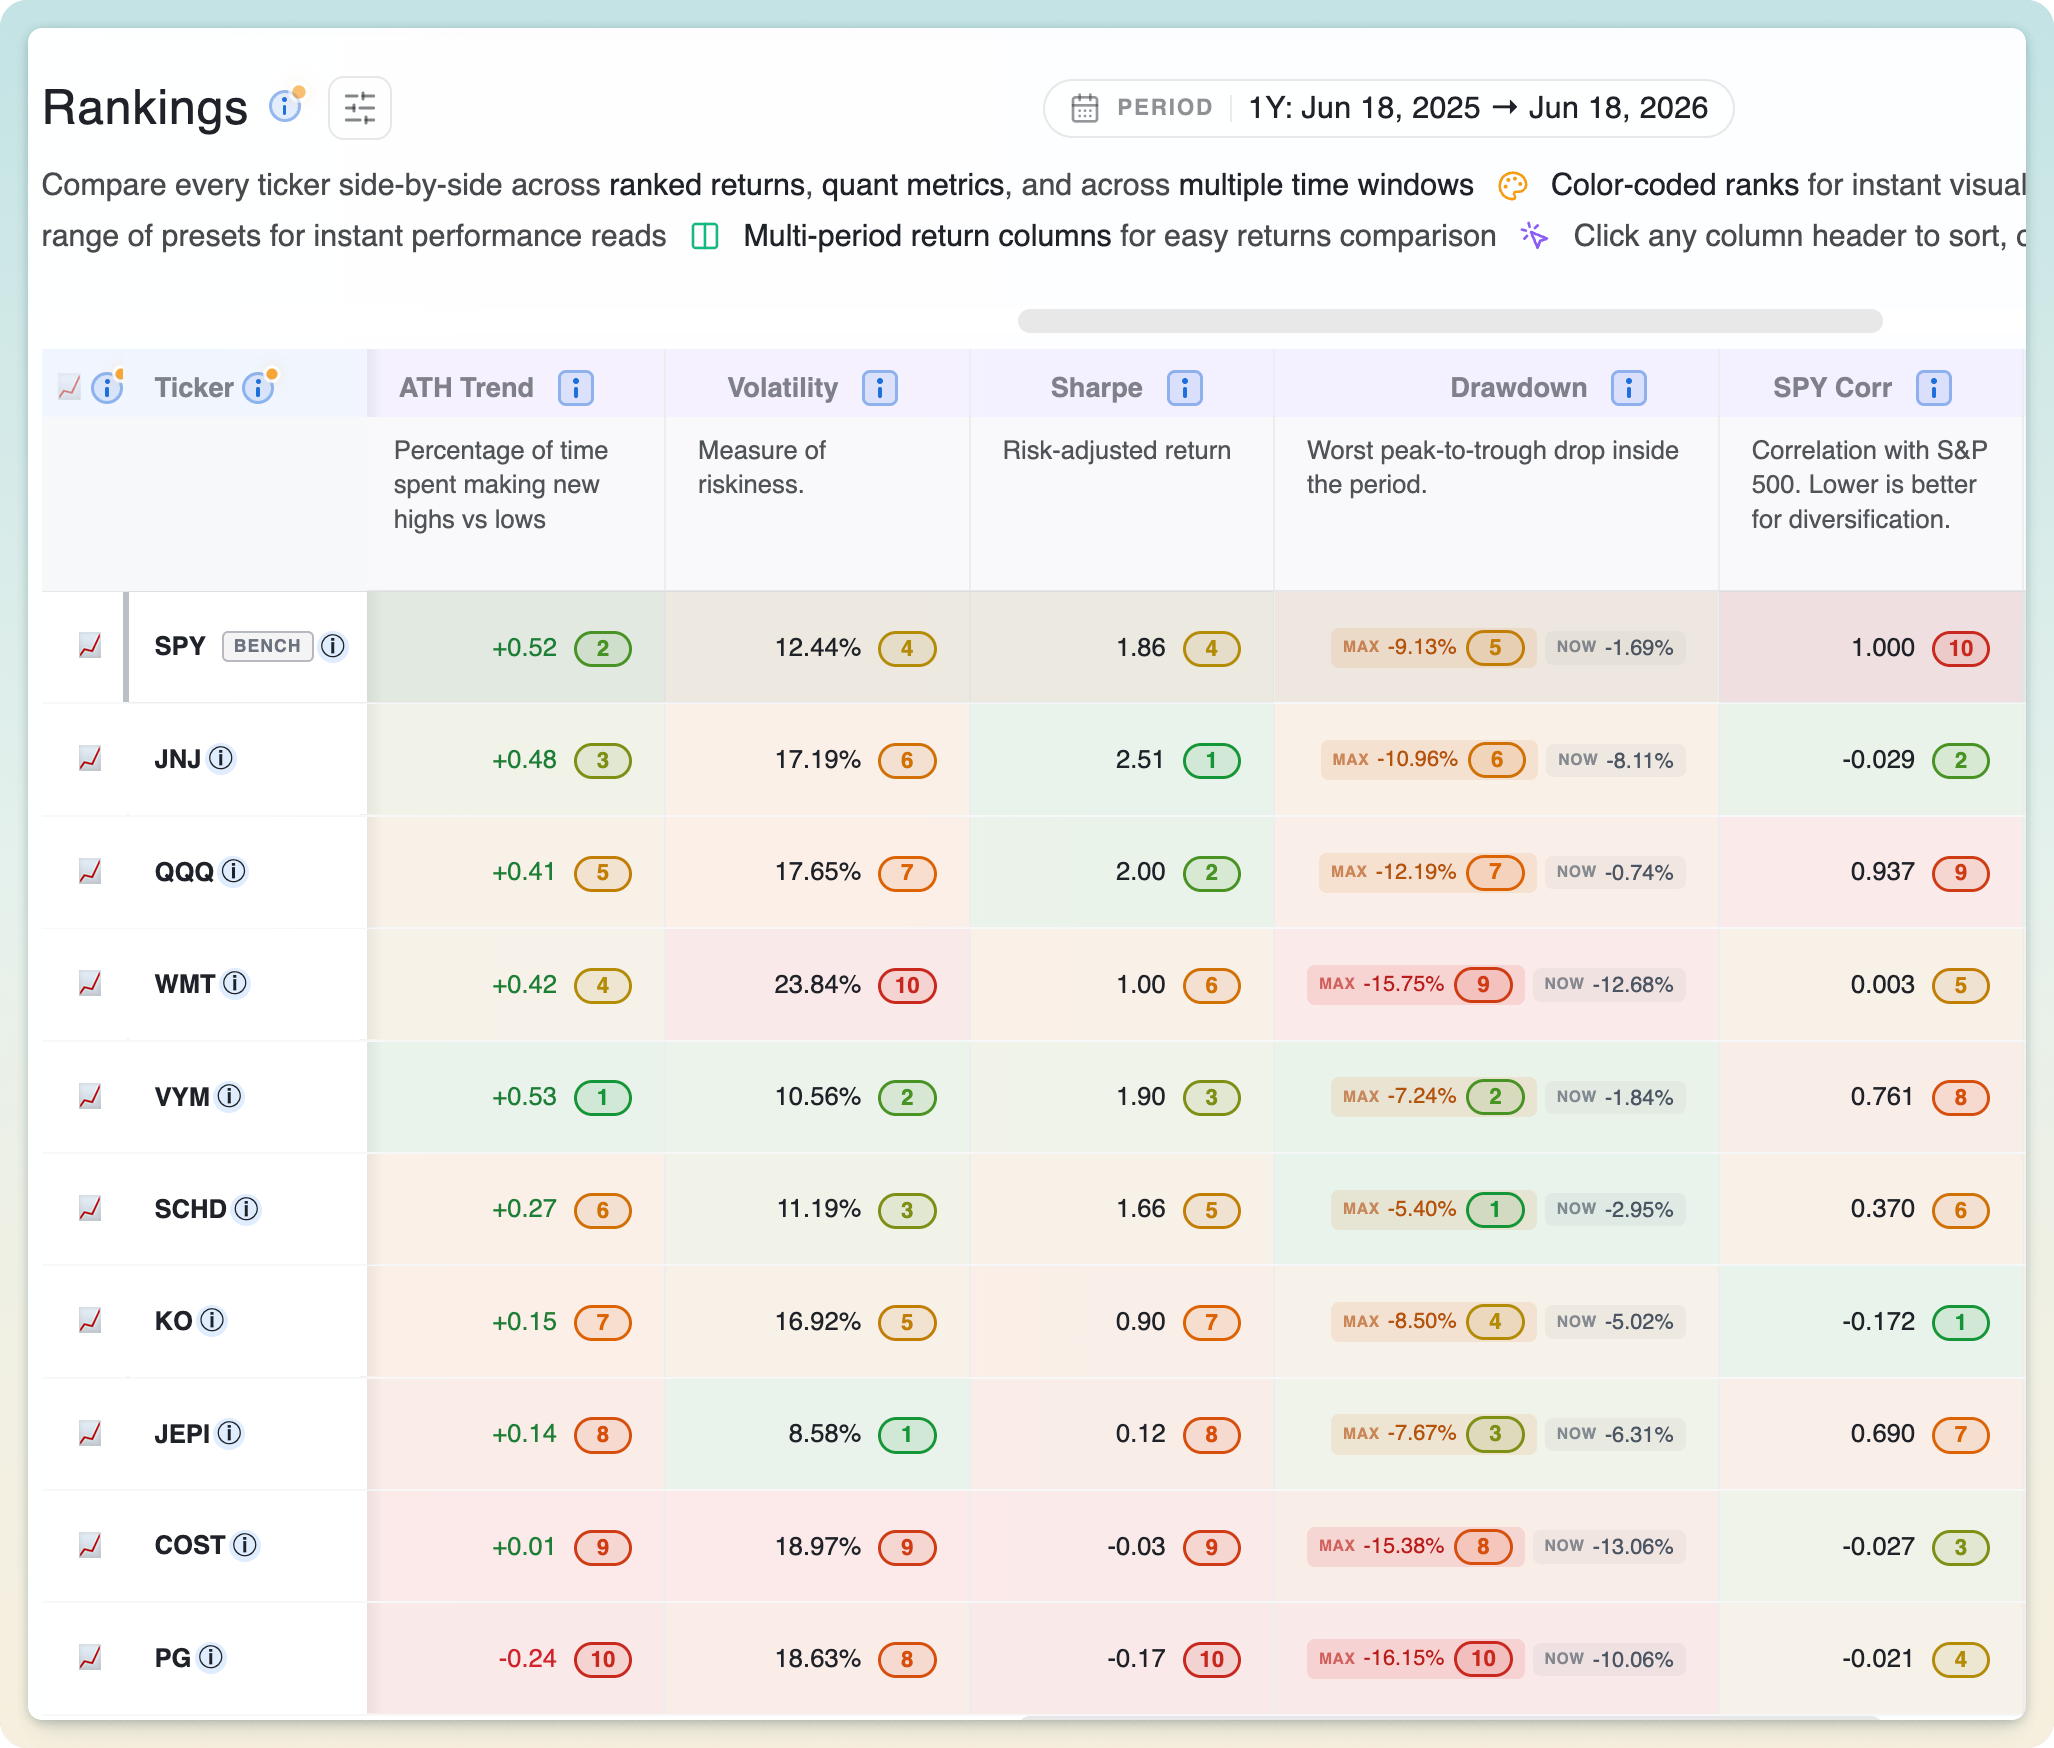
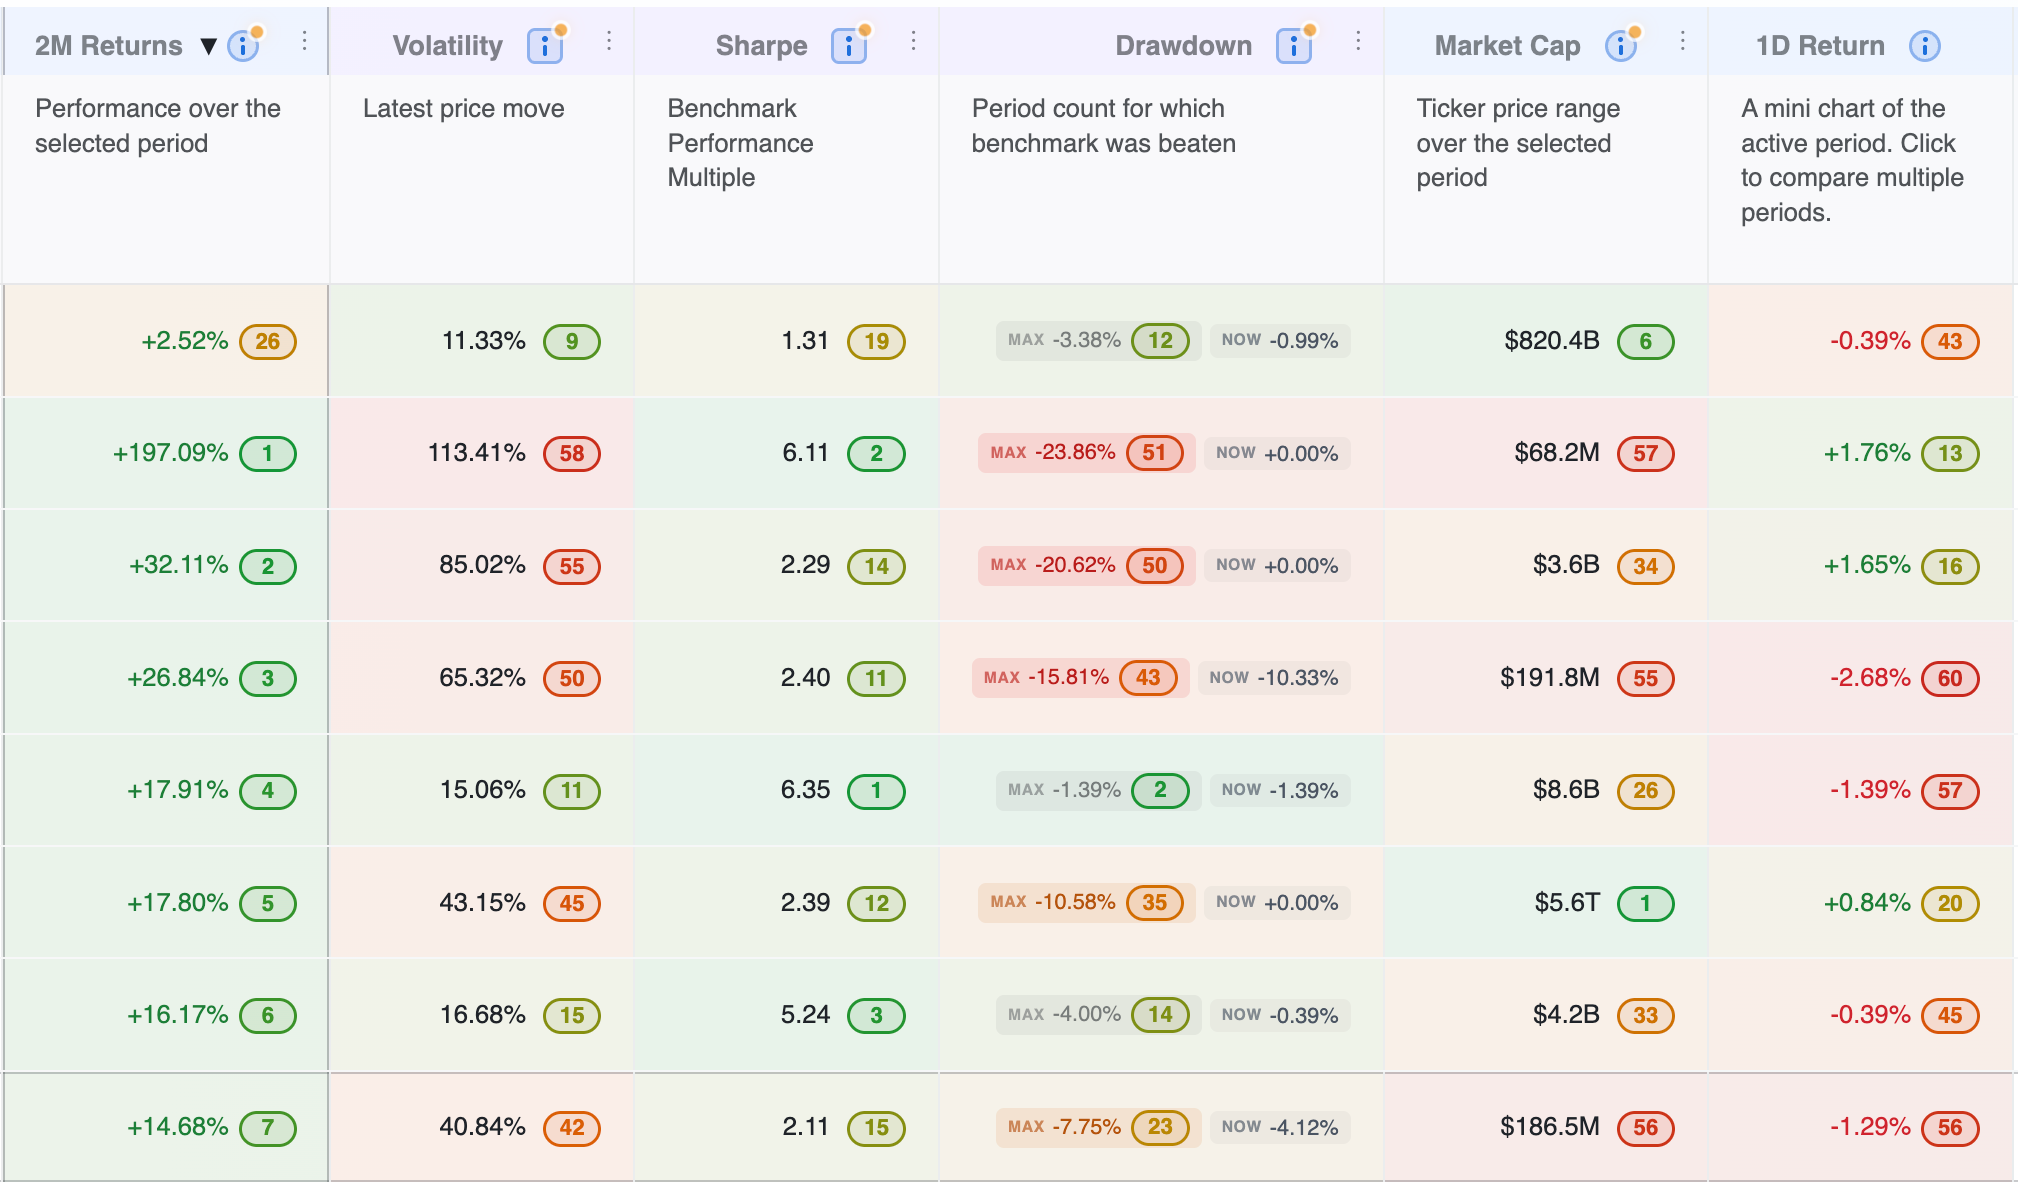
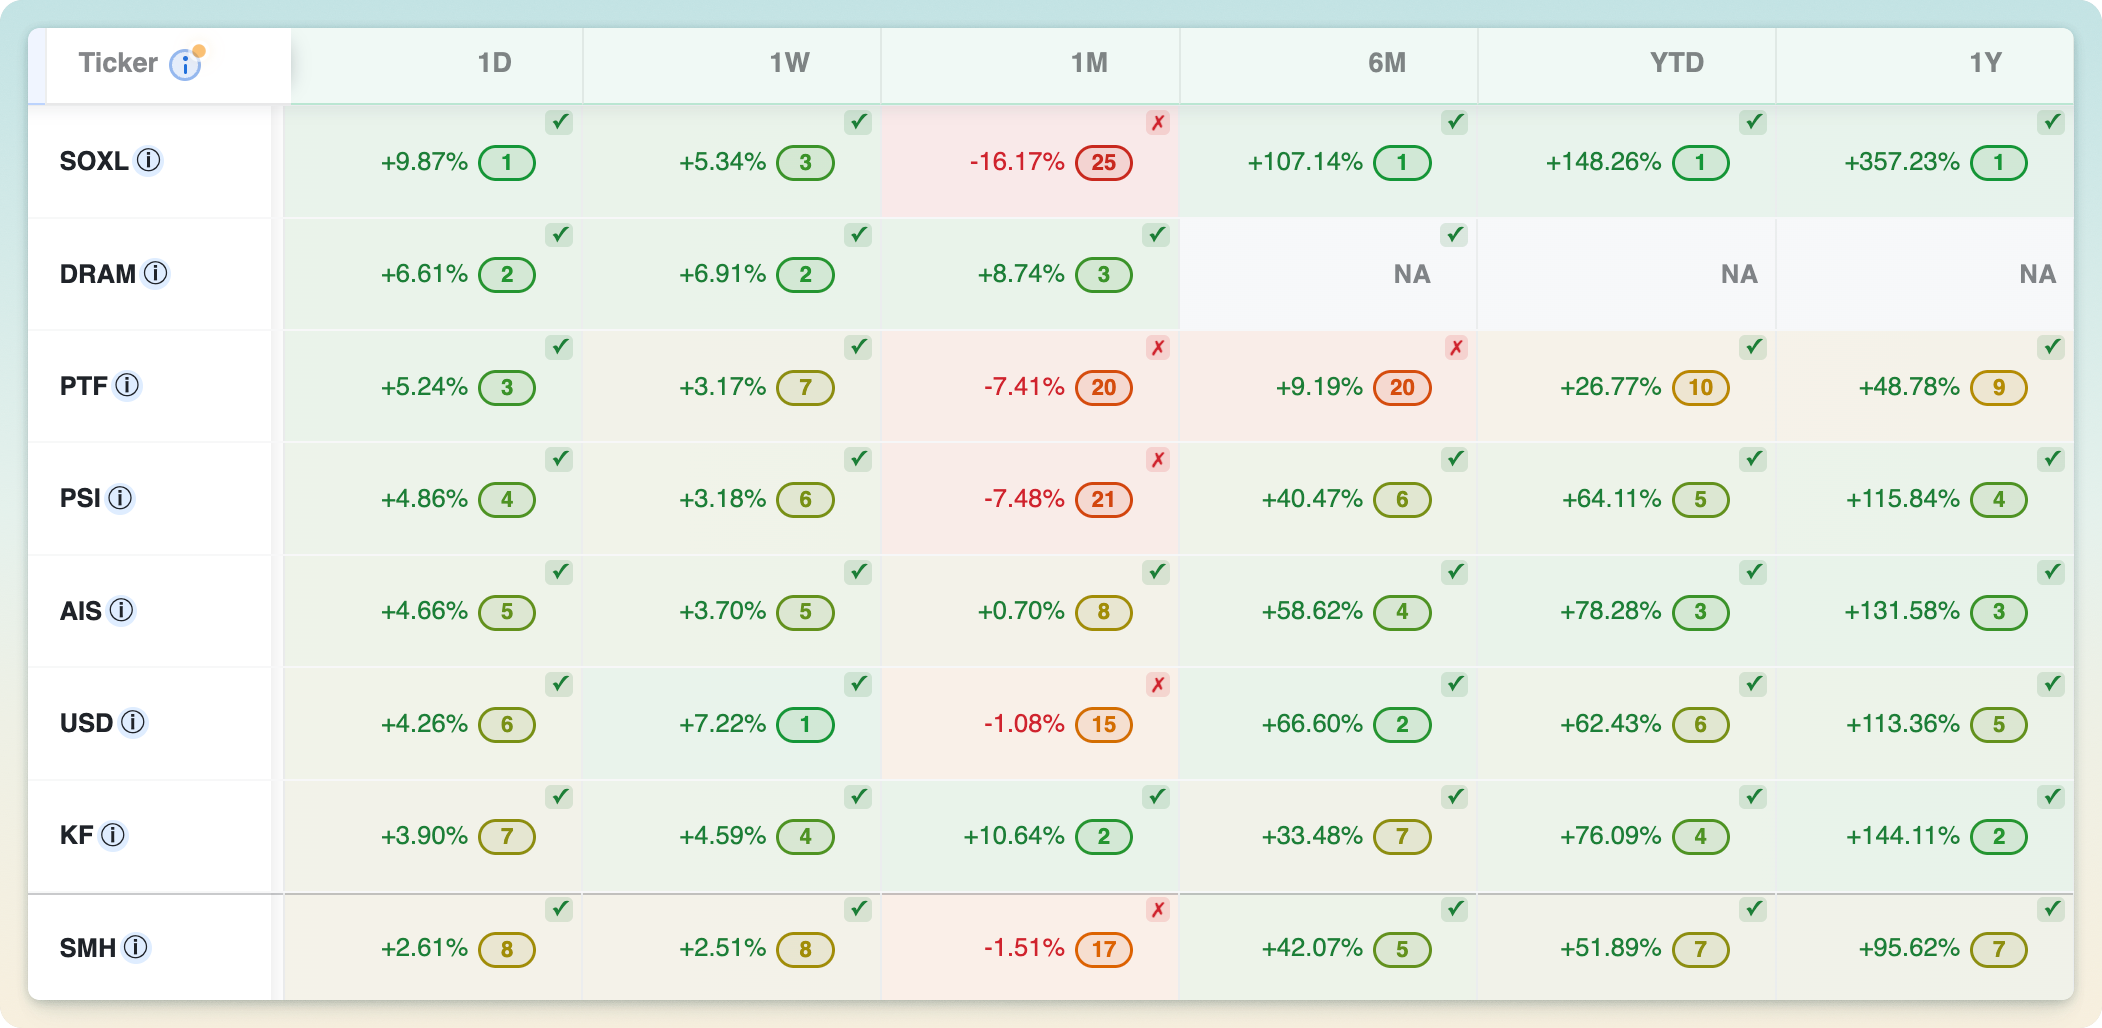
Every ticker is ranked across whatever metric you sort by: return, Sharpe, drawdown, market cap, and more. One click sorts, another reverses, and the whole table re-ranks instantly when you change tickers or timeframe.
02
Color coded
Values and ranks are color-coded throughout the table (green for strength, red for weakness), so the leaders and laggards in any column stand out without reading a single number.
03
Sparkline charts with benchmark comparison
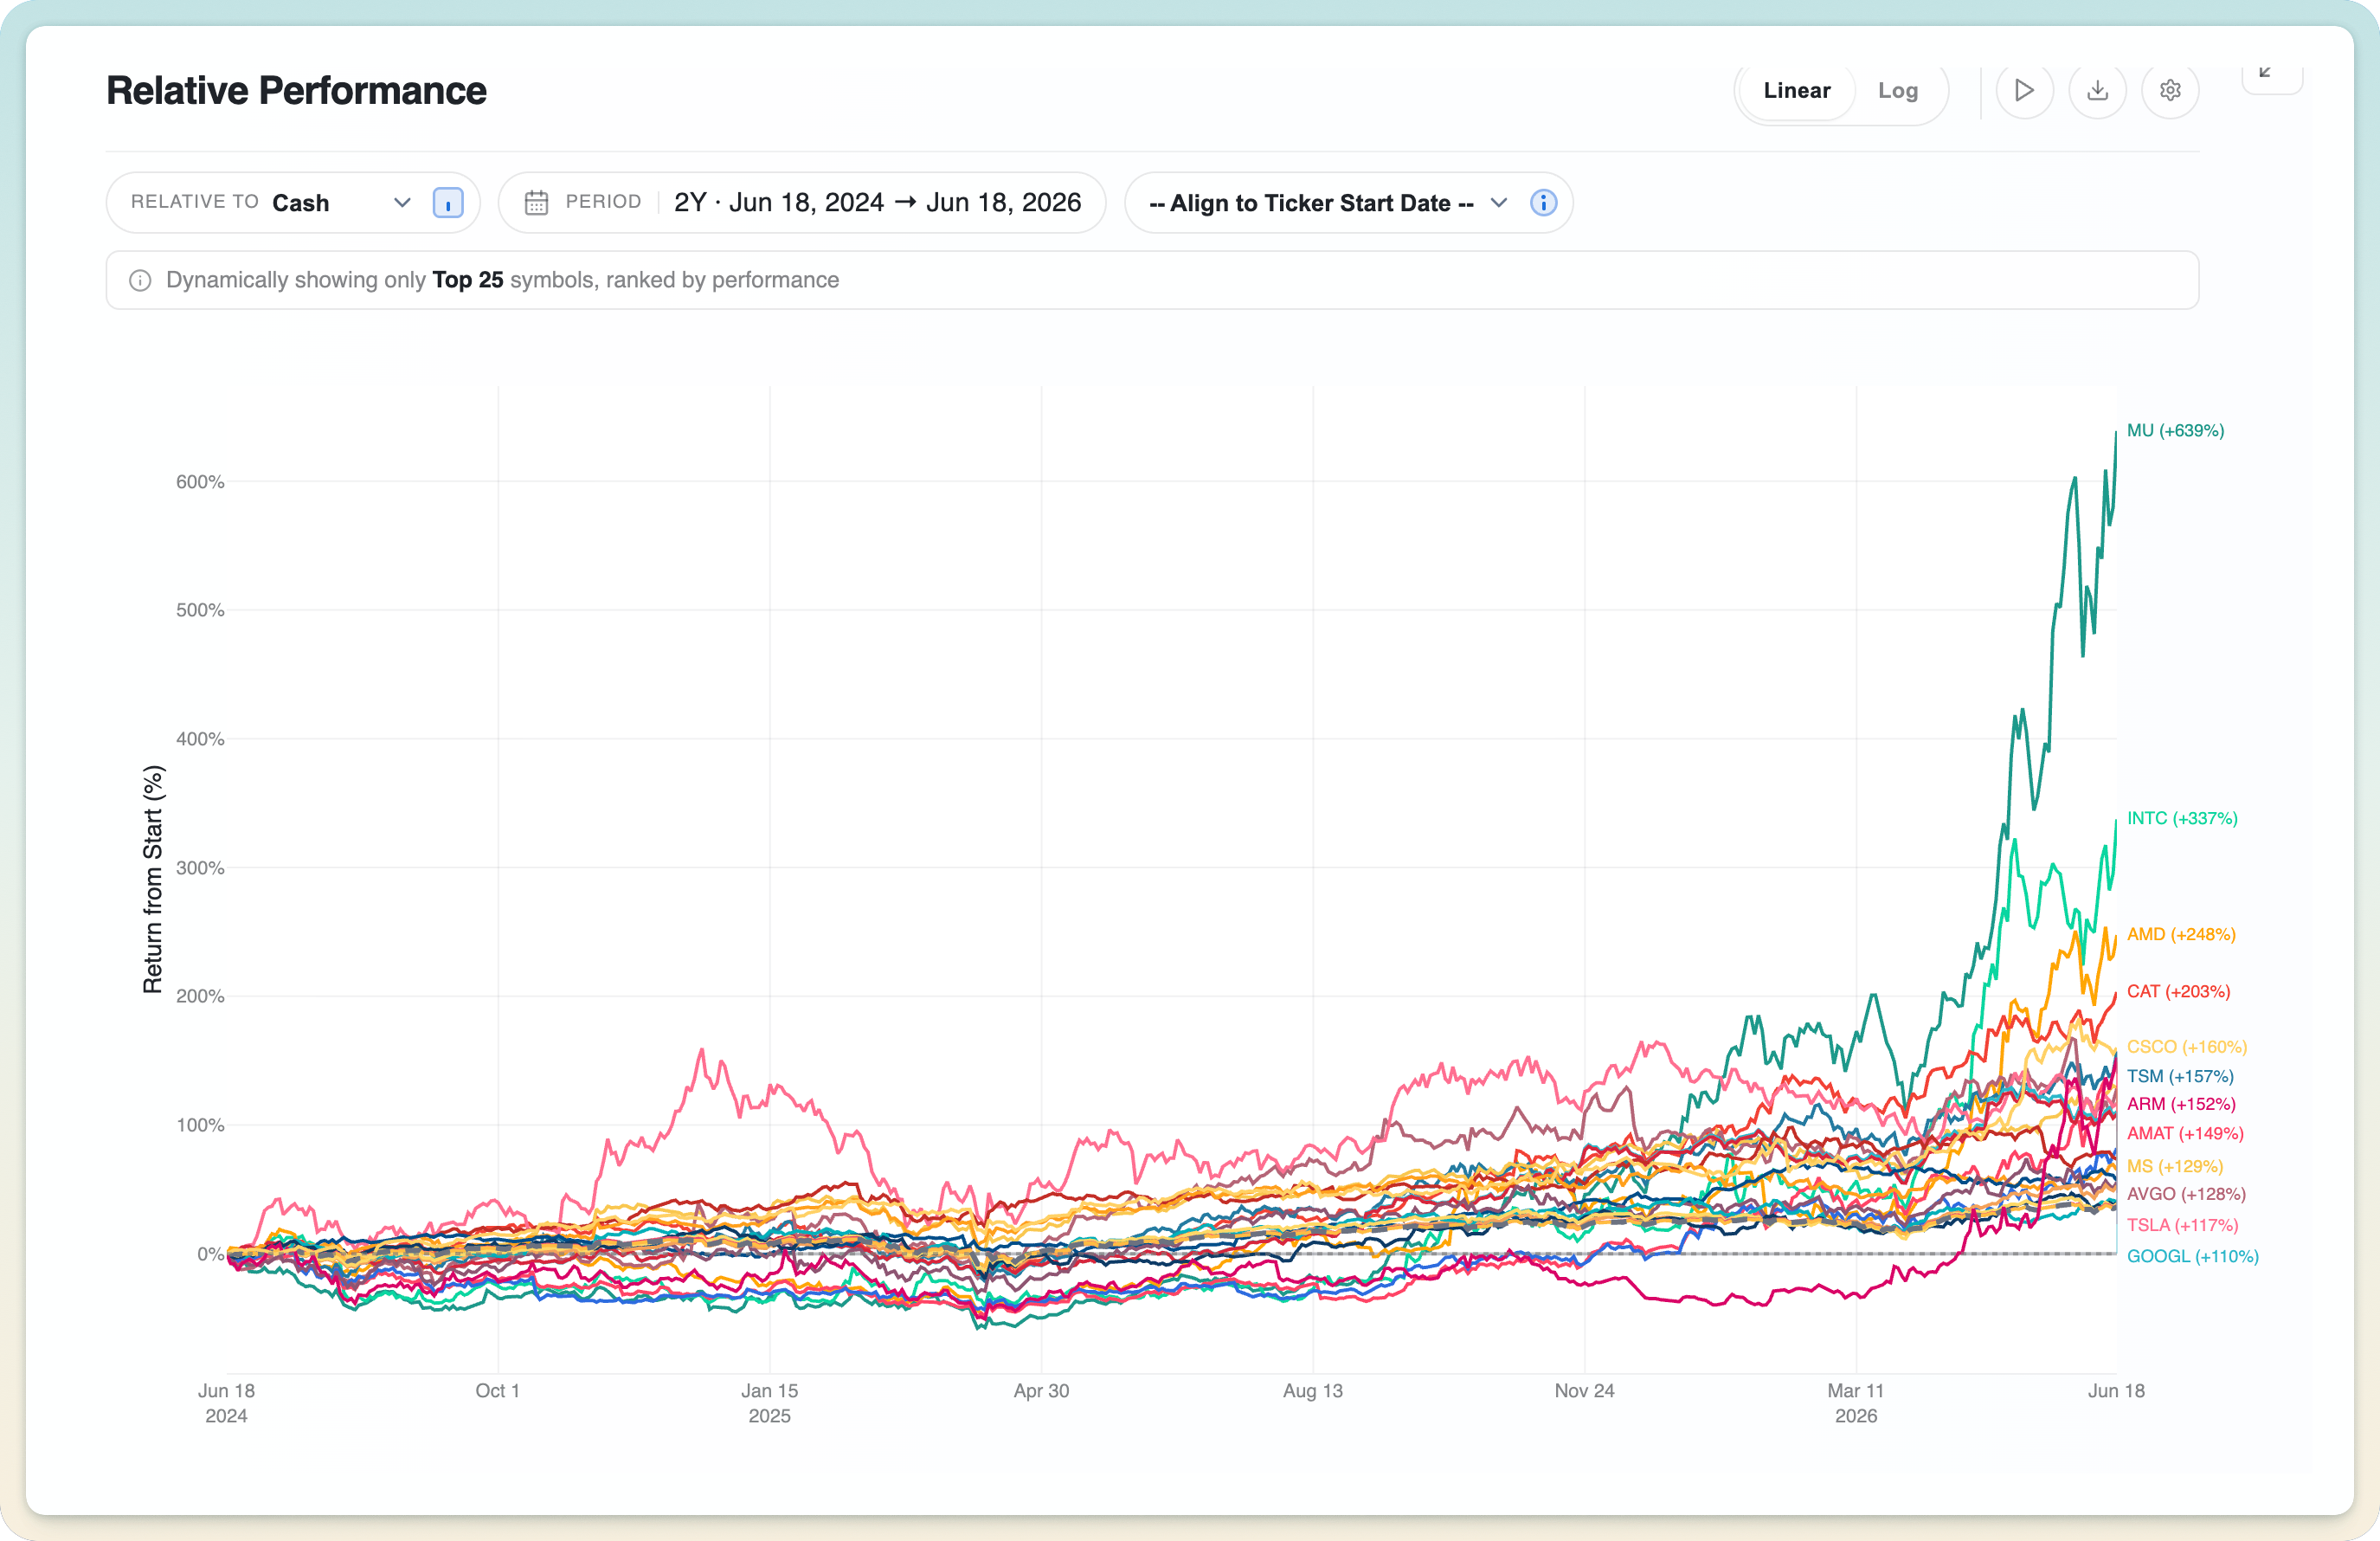
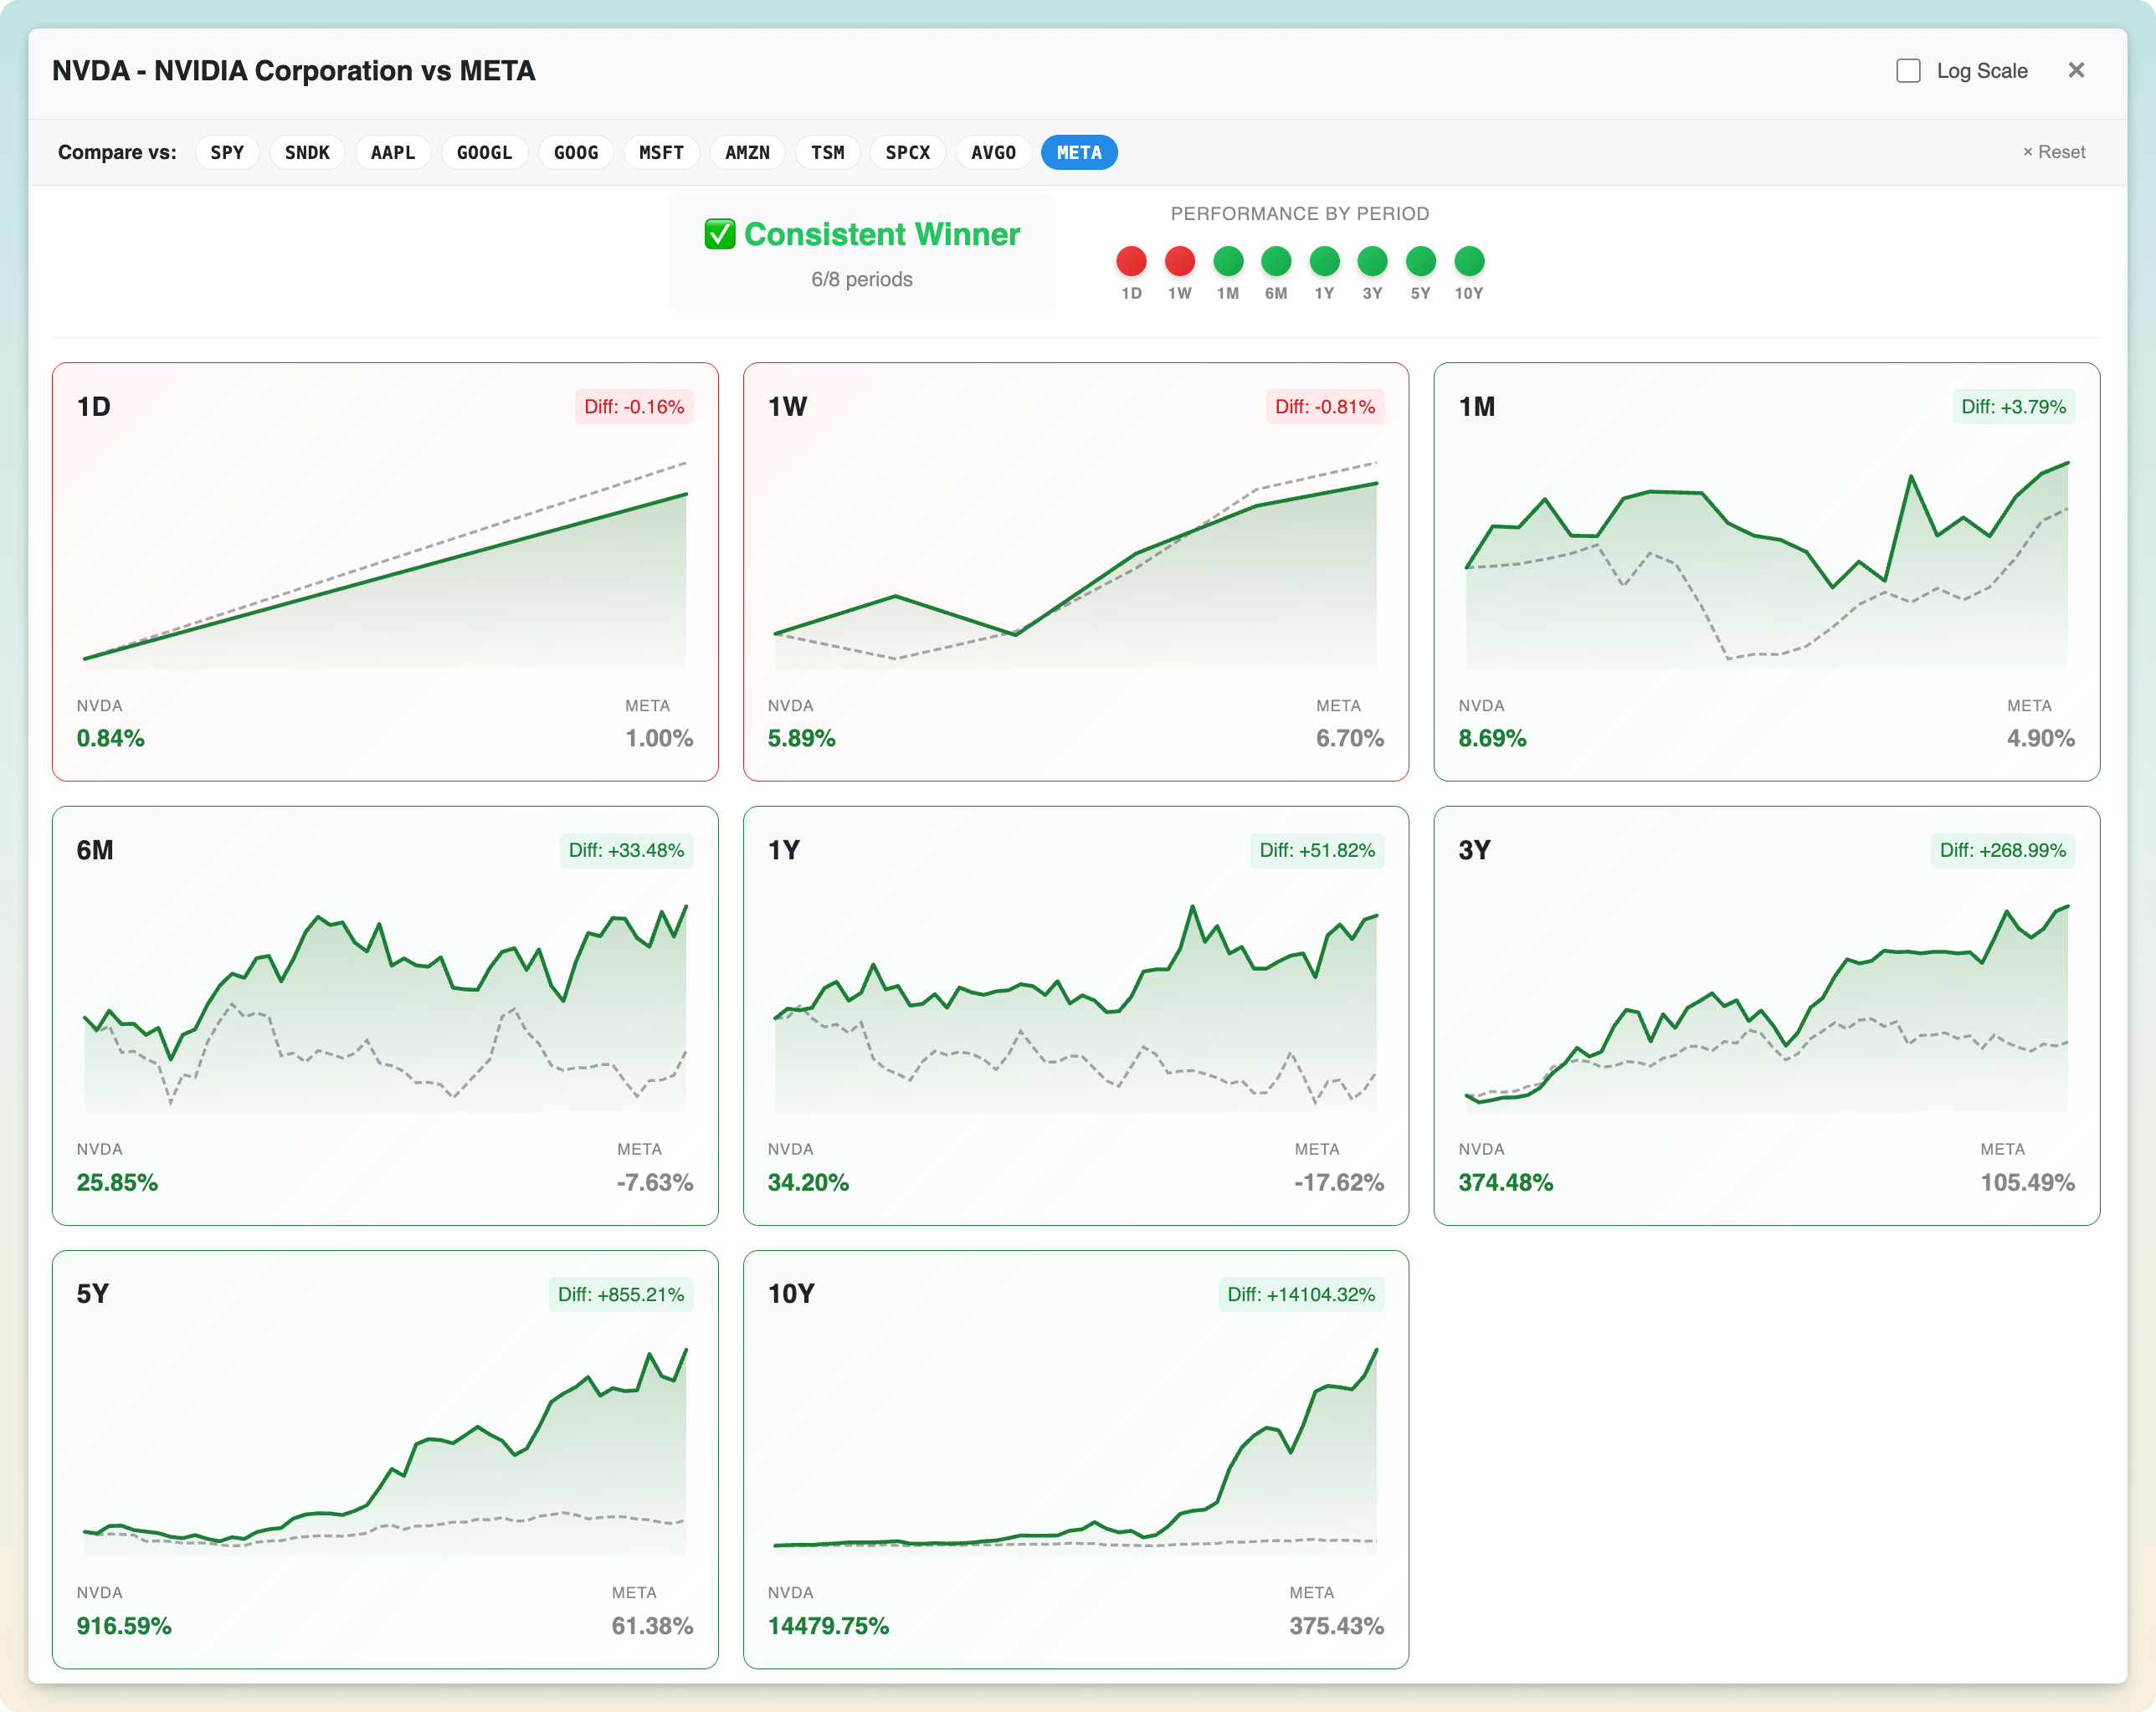
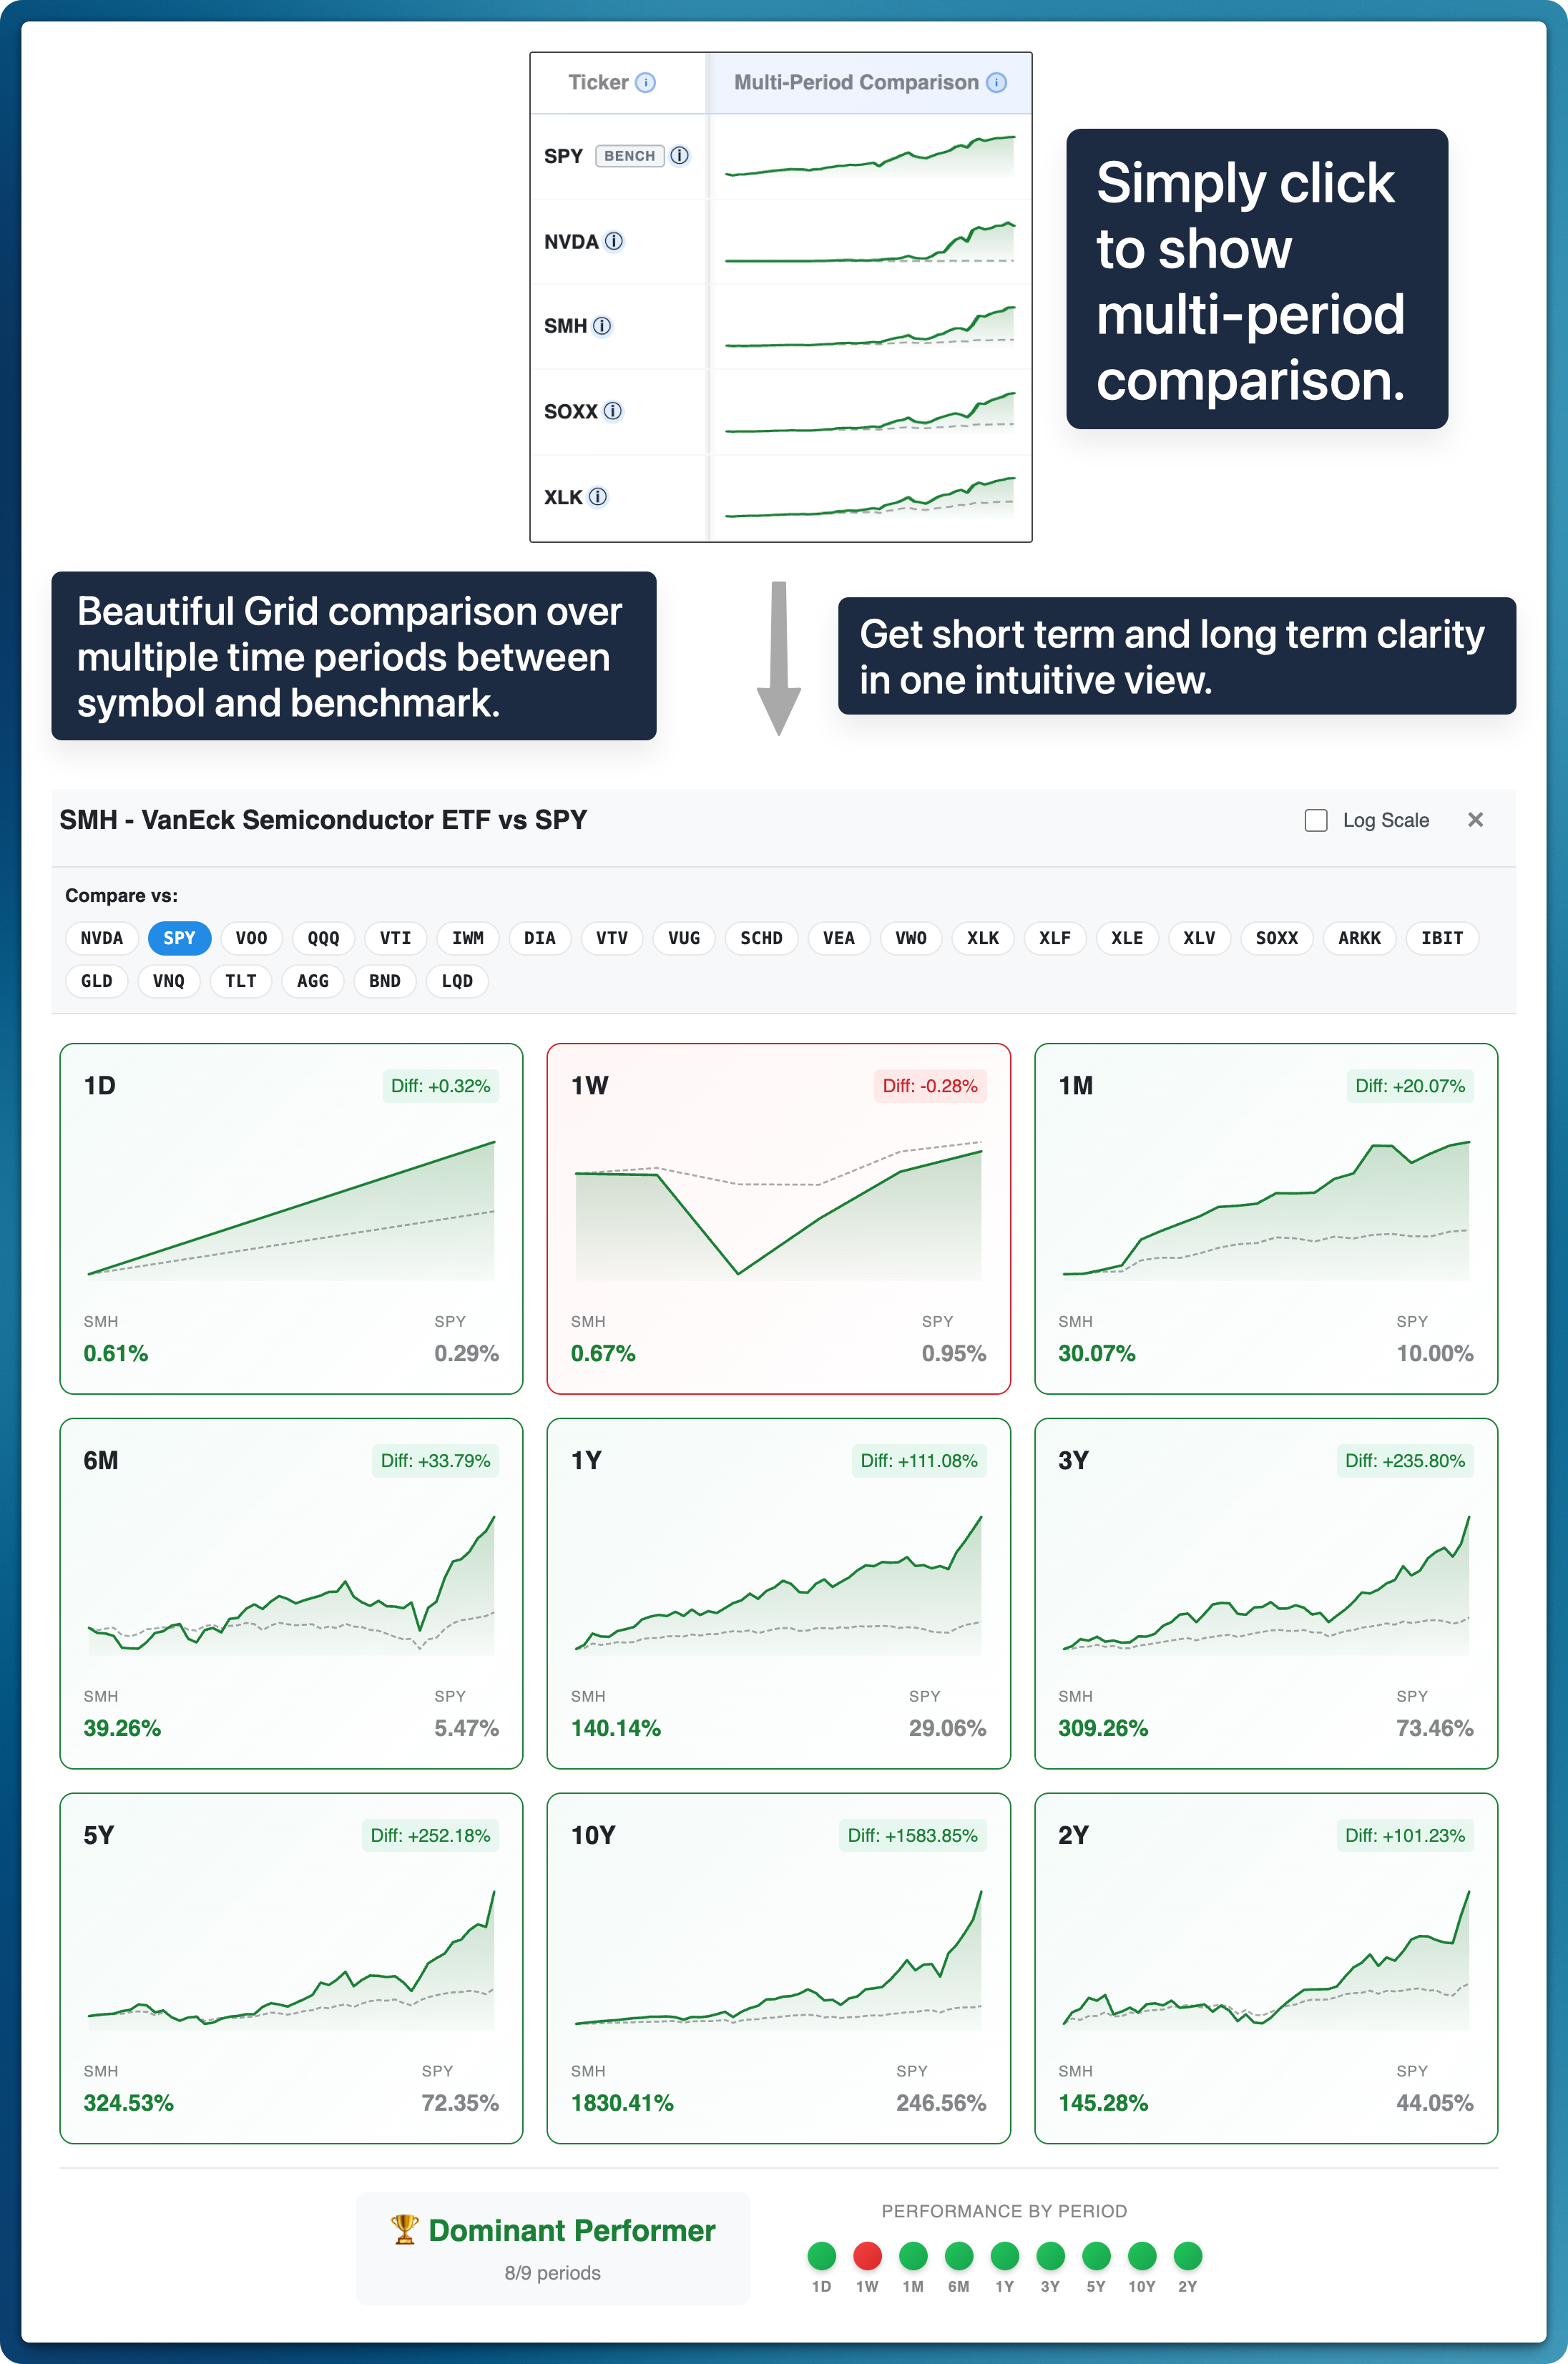
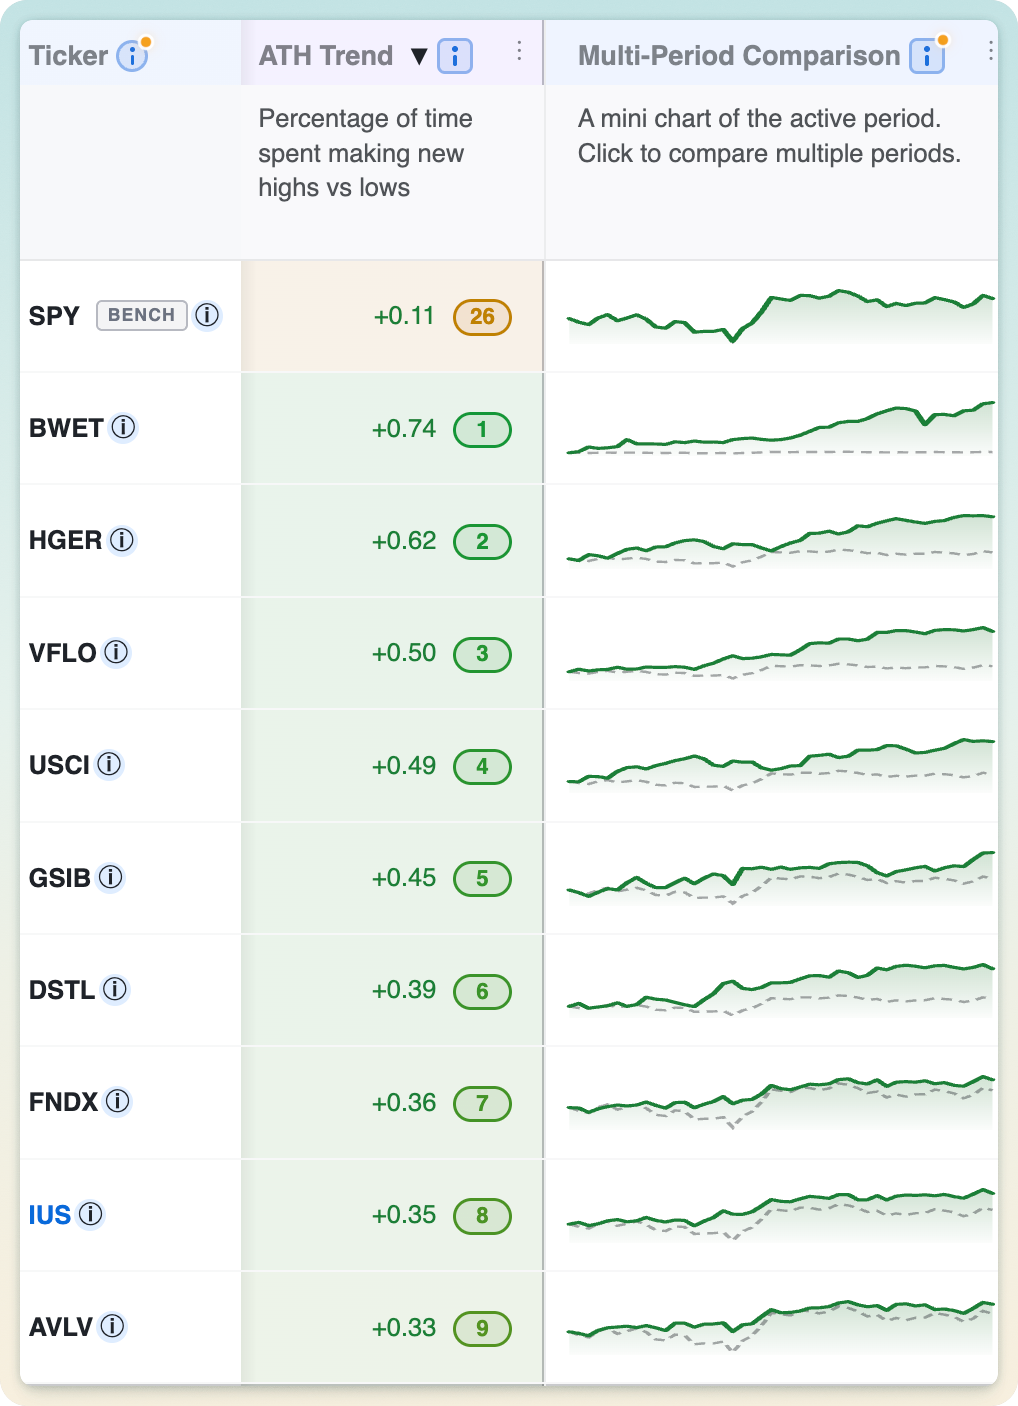
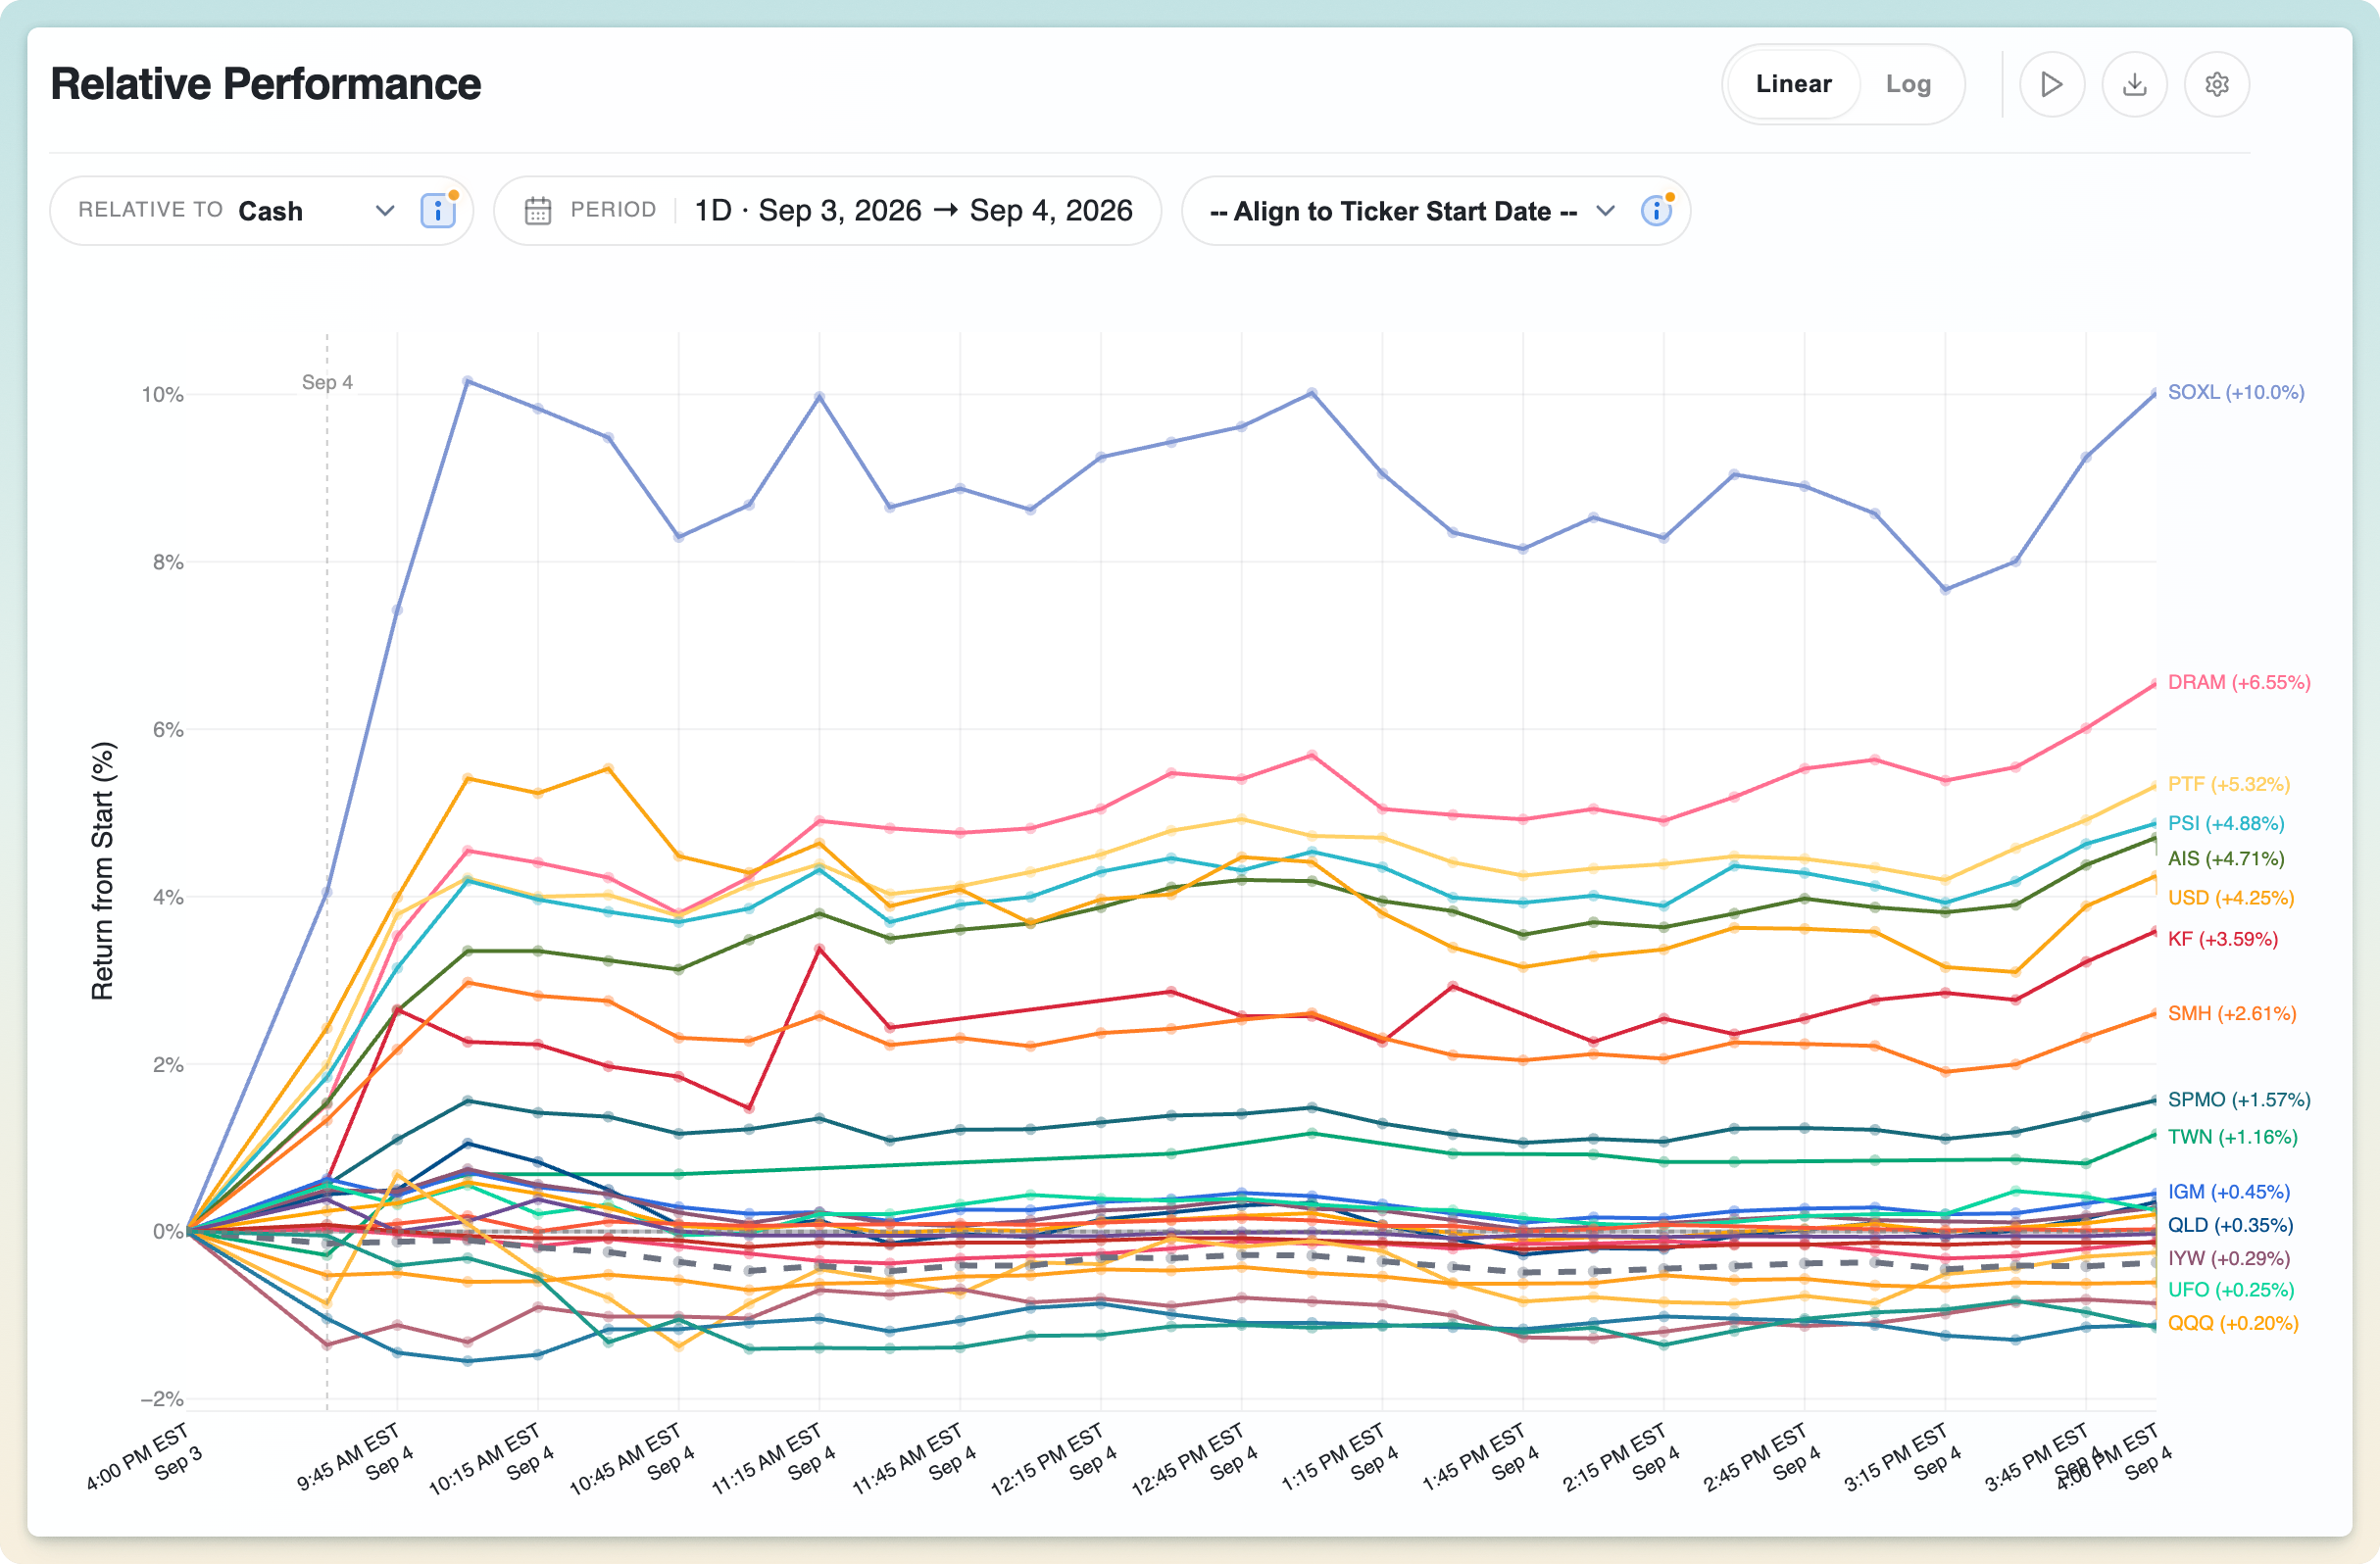
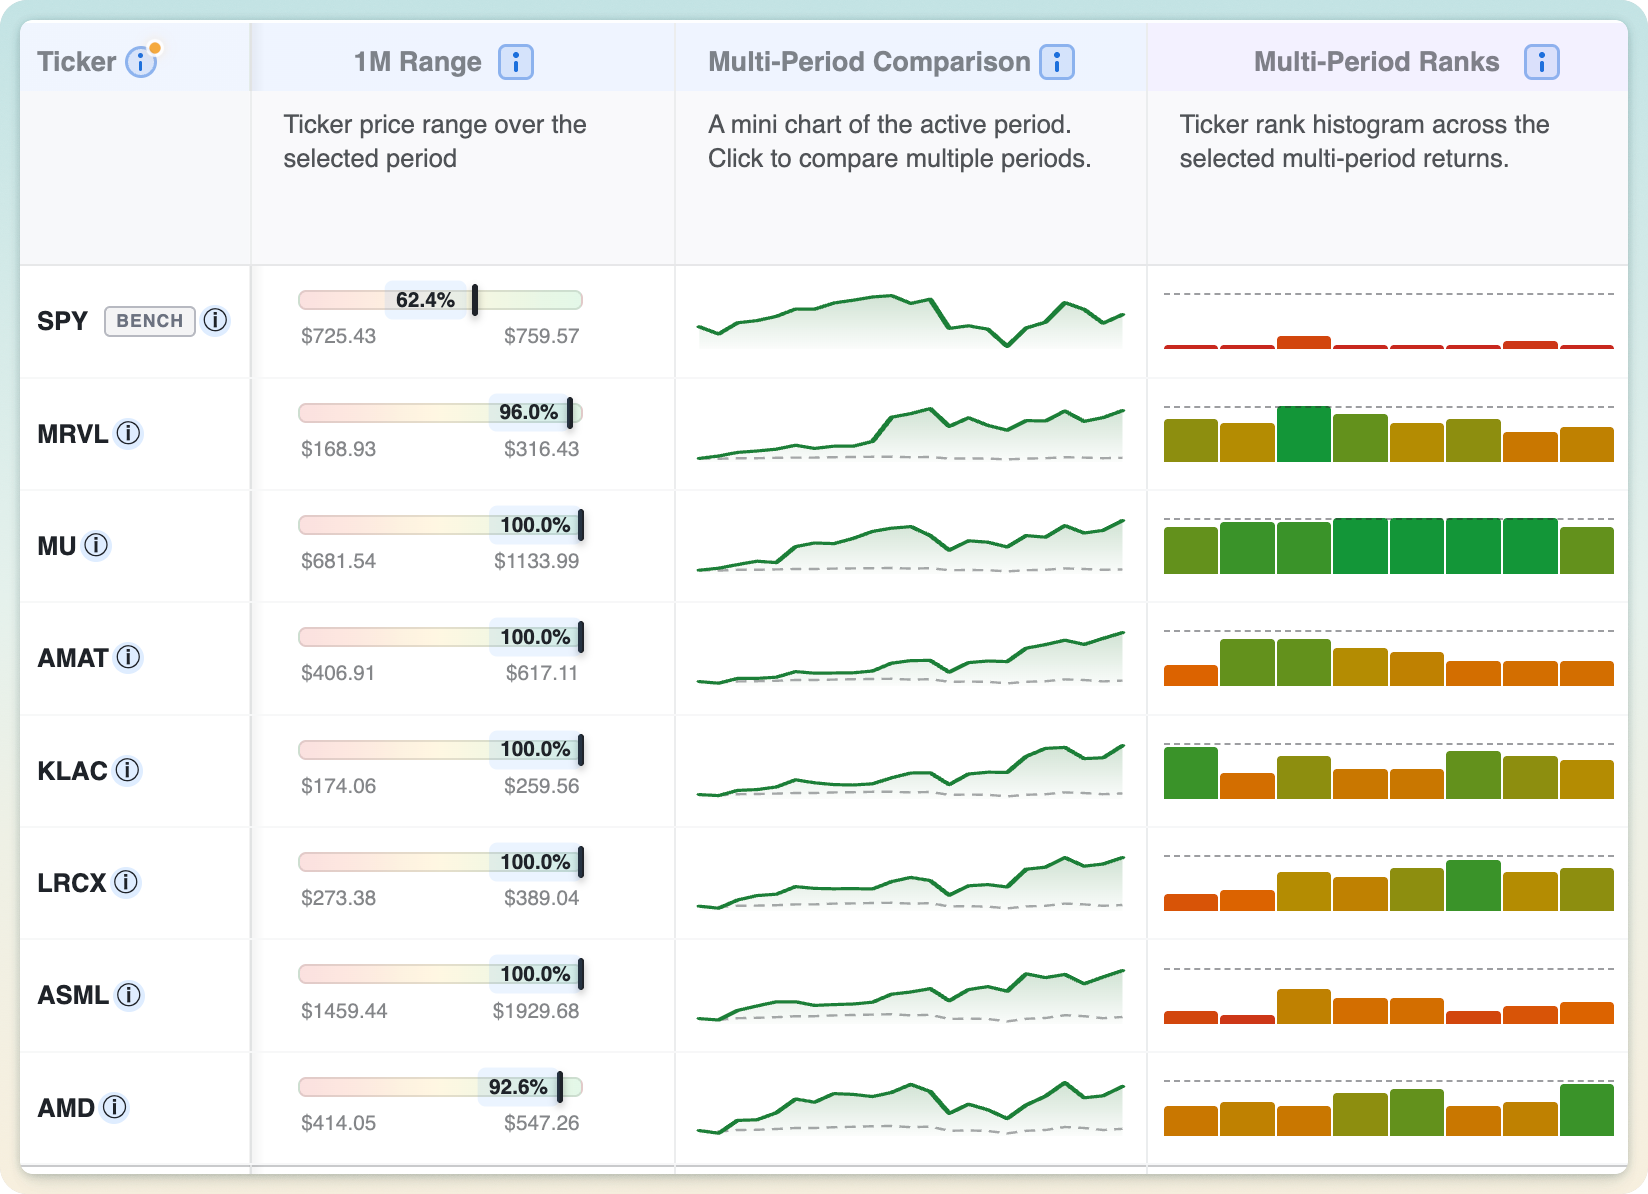
Each row carries a mini chart of the ticker's path over the active period, drawn against the benchmark so out- and under-performance reads at a glance. Click any sparkline to expand it and compare multiple periods side by side.
04
Multi-period ranking histogram
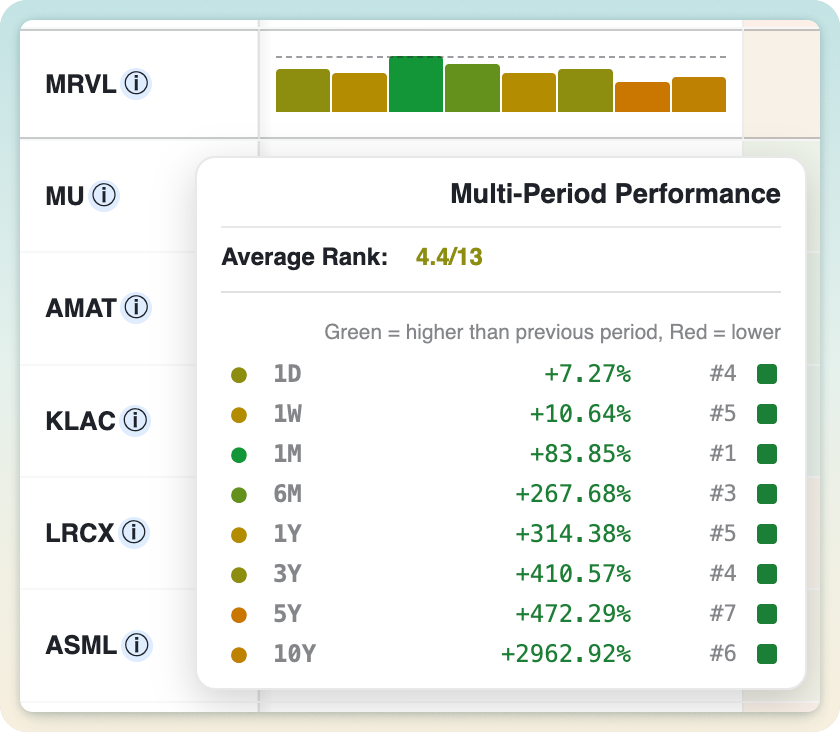
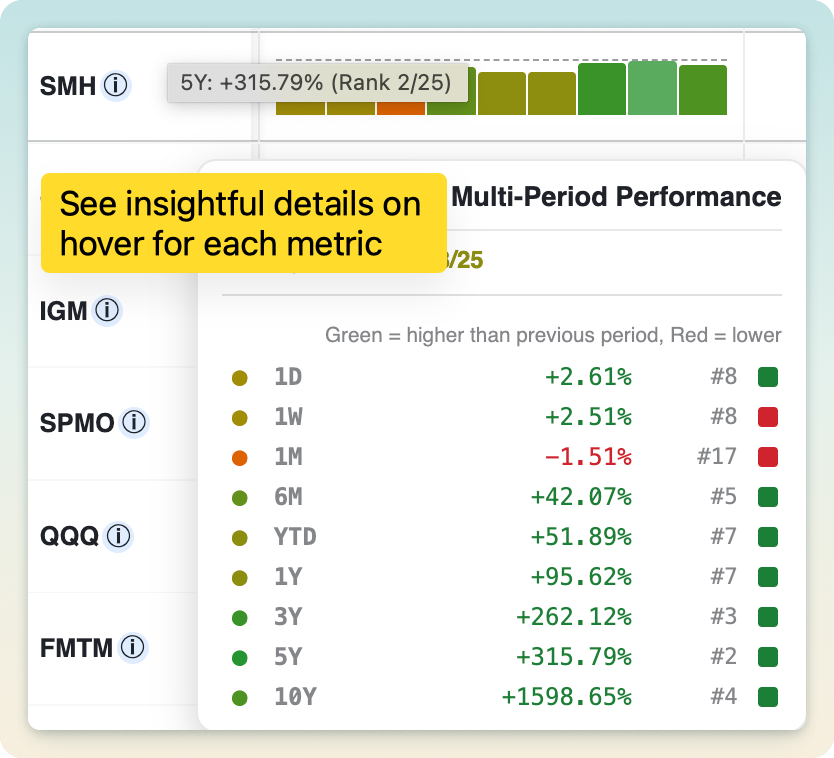
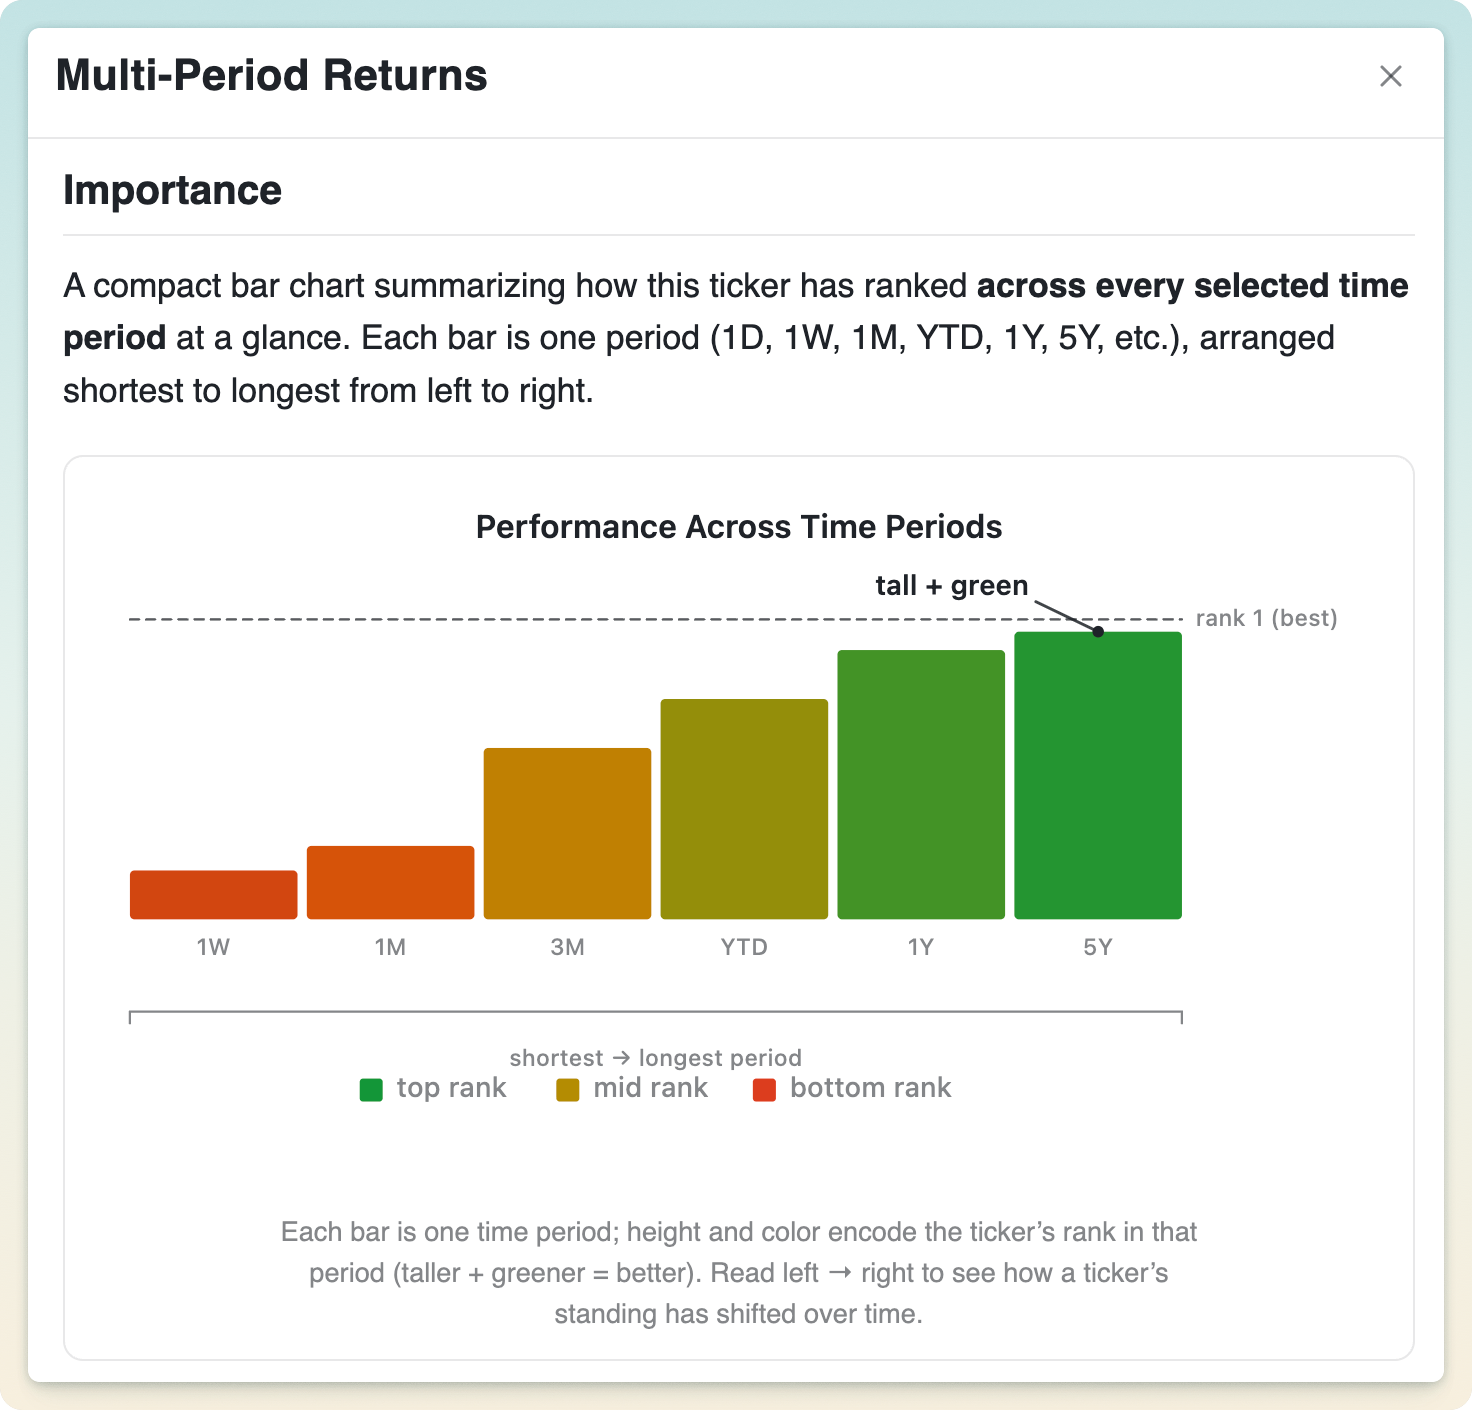
A compact histogram shows how each ticker ranks across every selected time period at once, so you immediately see relative rankings across all time periods, and can tell a consistent all-around performer from a one-window wonder.
05
Visual price range across any time preset
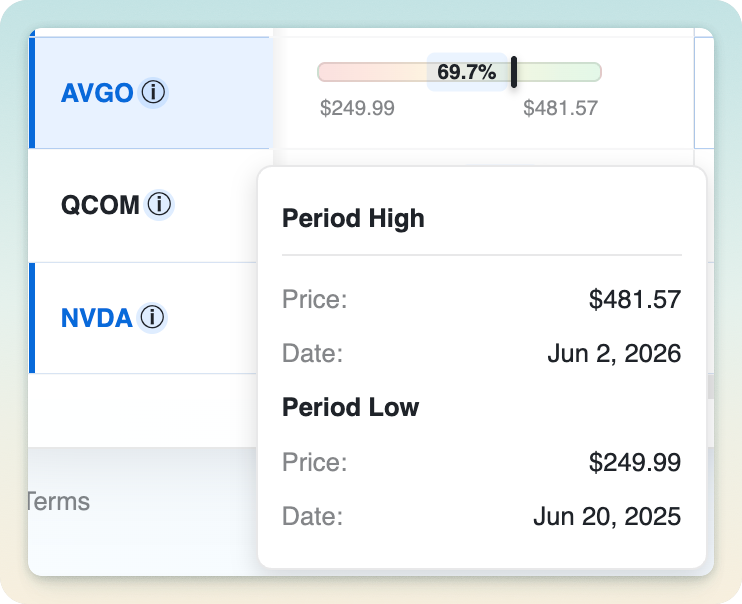
A visual bar shows where the current price sits between the period's low and high. Toward the right and the ticker is near its peak; toward the left and it's closer to its lows. Handy for spotting potential value or stretched names.
06
Hedge-fund-level quantitative metrics
Sharpe ratio, volatility, drawdowns, correlation, CAGR and more: the same risk-adjusted measures professional desks rely on, computed for every ticker over your exact timeframe.
07
Volatility and allocation guidance
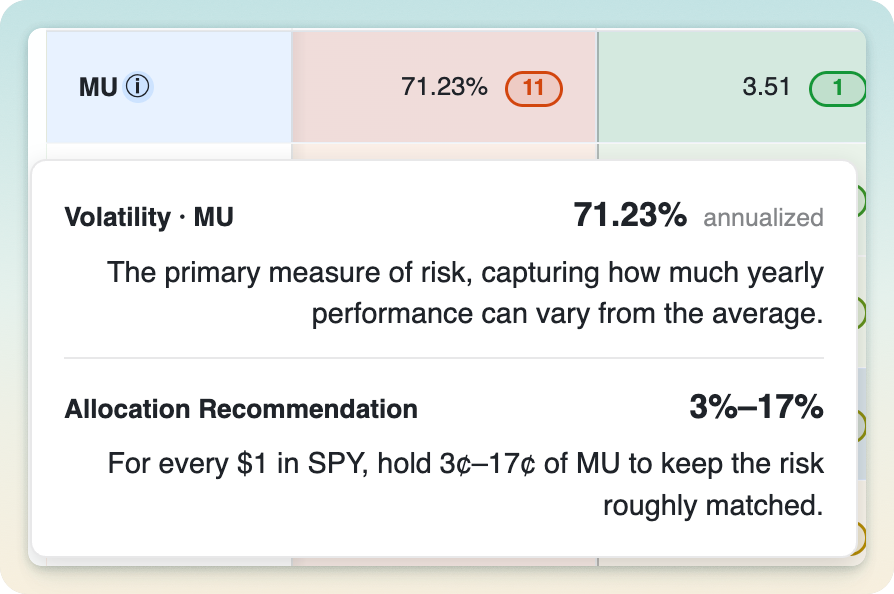
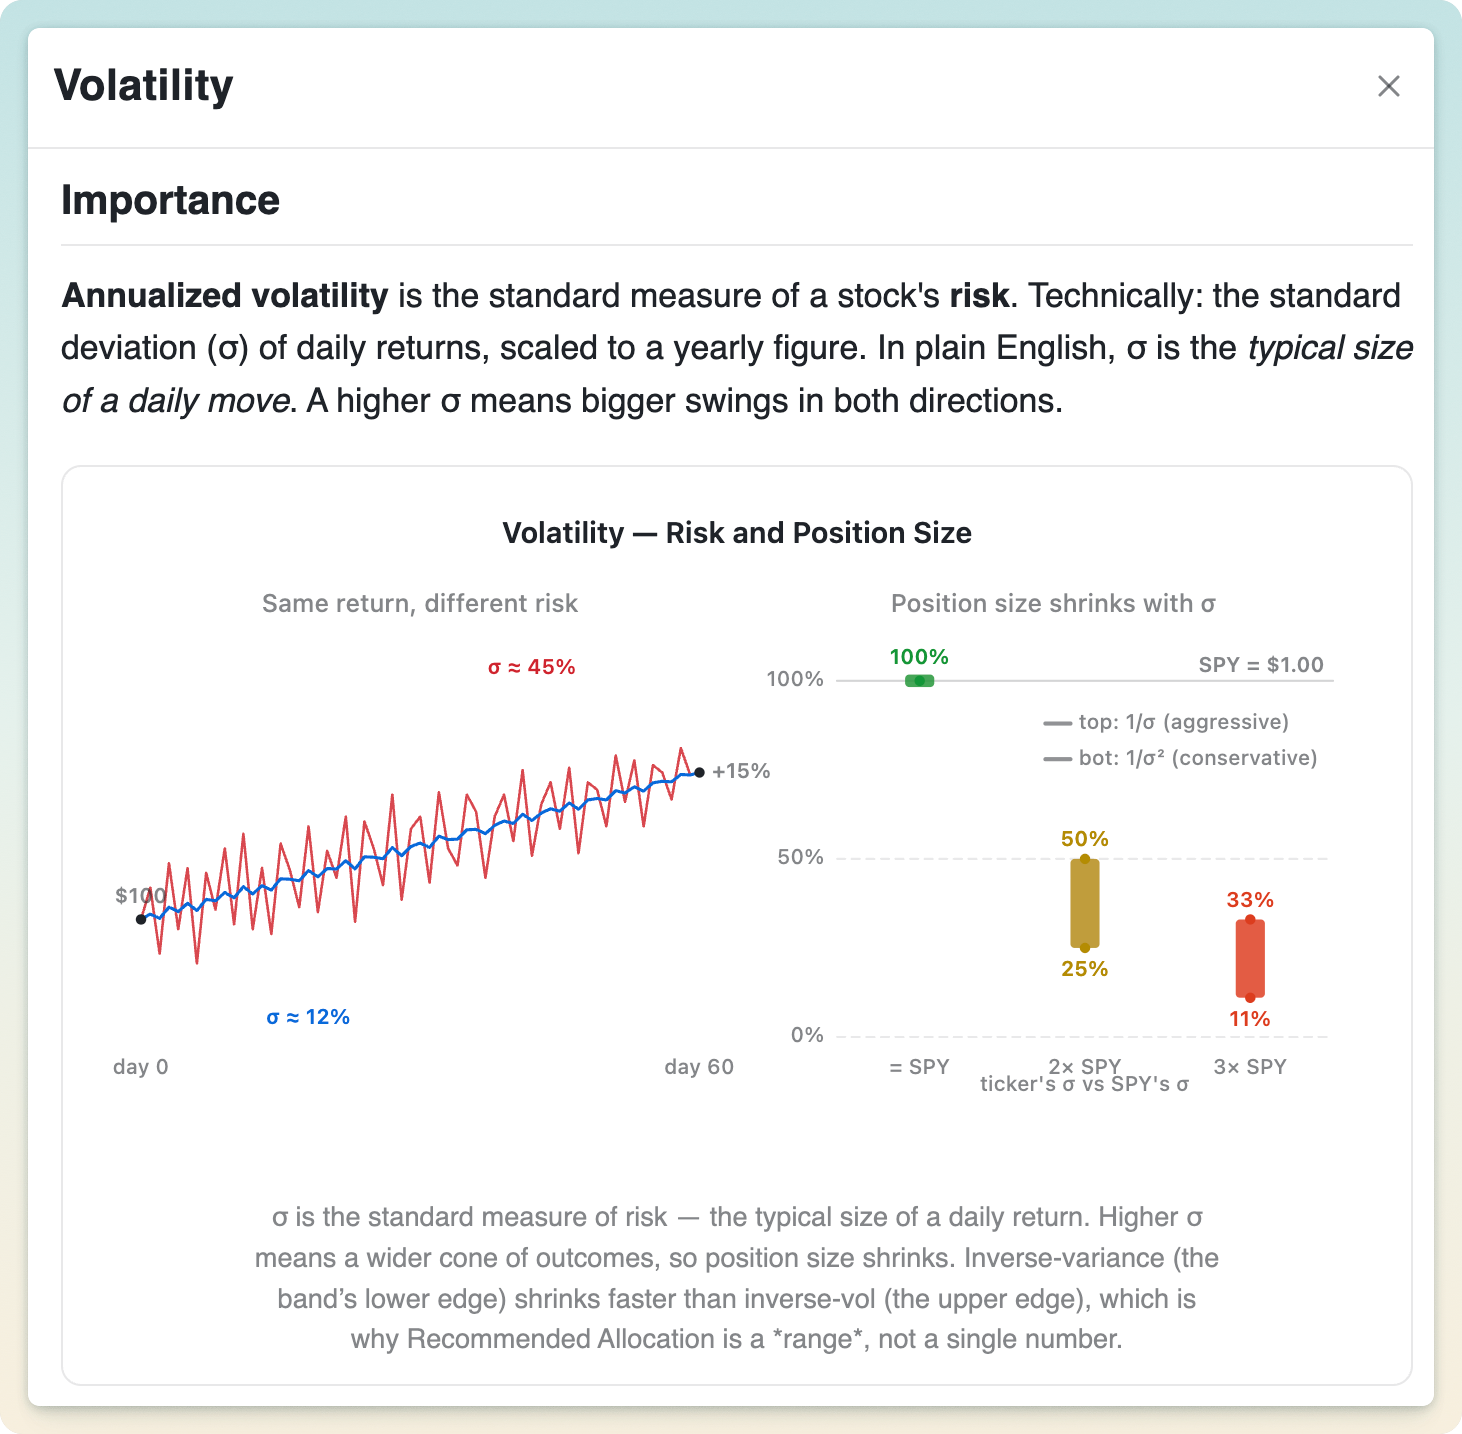
See how much each ticker swings (annualized volatility), then get a risk-aware sizing range versus SPY based on that relative volatility. It turns "how risky is this?" into "roughly how much should I hold?"
08
Easy diversification evaluation
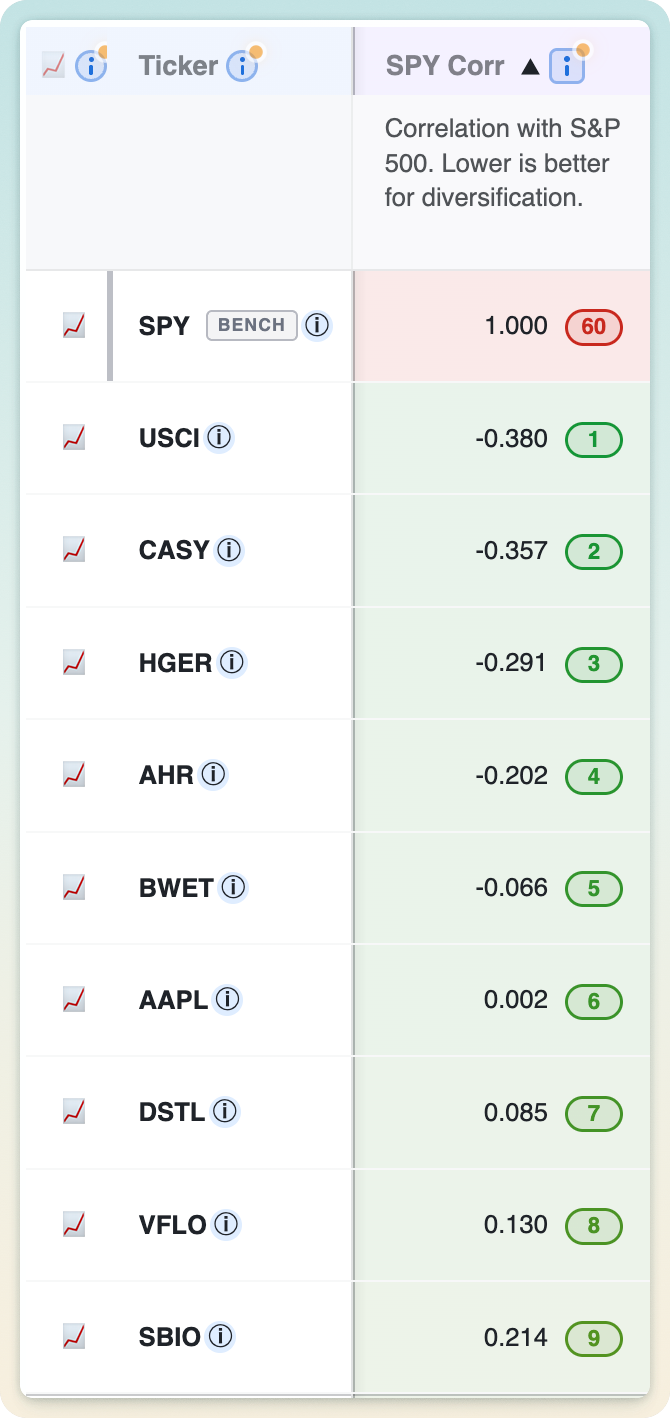
Each ticker's correlation to the S&P 500 shows how much it moves with the market. Lower correlation means more genuine diversification. It's an easy way to build a basket that doesn't all sink together.
09
Unique ATH/ATL Trend Score for easier buy and hold
A signed score from −1 to +1 measuring how persistently a ticker keeps making new highs versus new lows over the period, weighted toward recent action. Strong positive scores flag relentless uptrends that tend to reward patient buy-and-hold.
10
Compare current and global drawdown
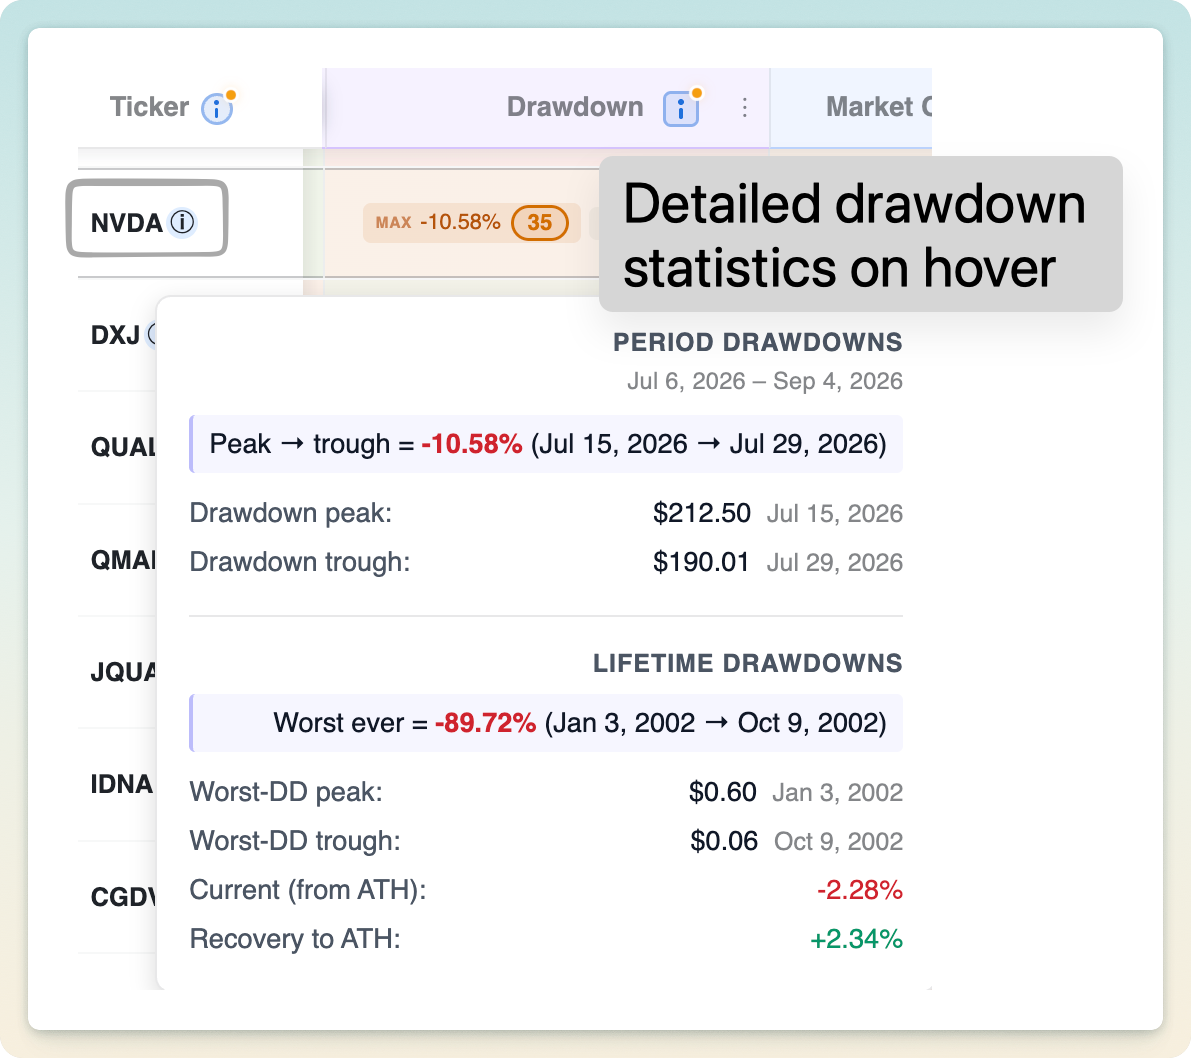
See both how far a ticker currently sits below its high and the worst peak-to-trough drop it suffered during the period. Together they show today's pain versus the deepest hole it has dug, a realistic downside picture.
11
Advanced compute engine: realtime metrics, not just end-of-day
A purpose-built engine recomputes the full metric set in real time using live intraday prices, not just yesterday's close. Change a ticker or timeframe and every number updates in milliseconds.
12
Multi-period metrics
Add return columns for any set of periods (1M, YTD, 1Y, 5Y, and beyond) to compare performance across many windows without leaving your current timeframe. Each period is ranked on its own for true cross-window comparison.
13
Smart Help to explain why each column matters
Every column carries a plain-English explanation of what it measures, the trade-offs involved, and when it matters. Learn as you go and uplevel as an investor, no finance degree required.
14
Smart Hover Intelligence
Hovering any cell reveals the detail behind the number: start and end prices with dates, the all-time high behind a drawdown, or a per-interval breakdown of a trend score. The metrics stay inspectable instead of opaque.
15
Detailed curation: add or remove tickers from any watchlist
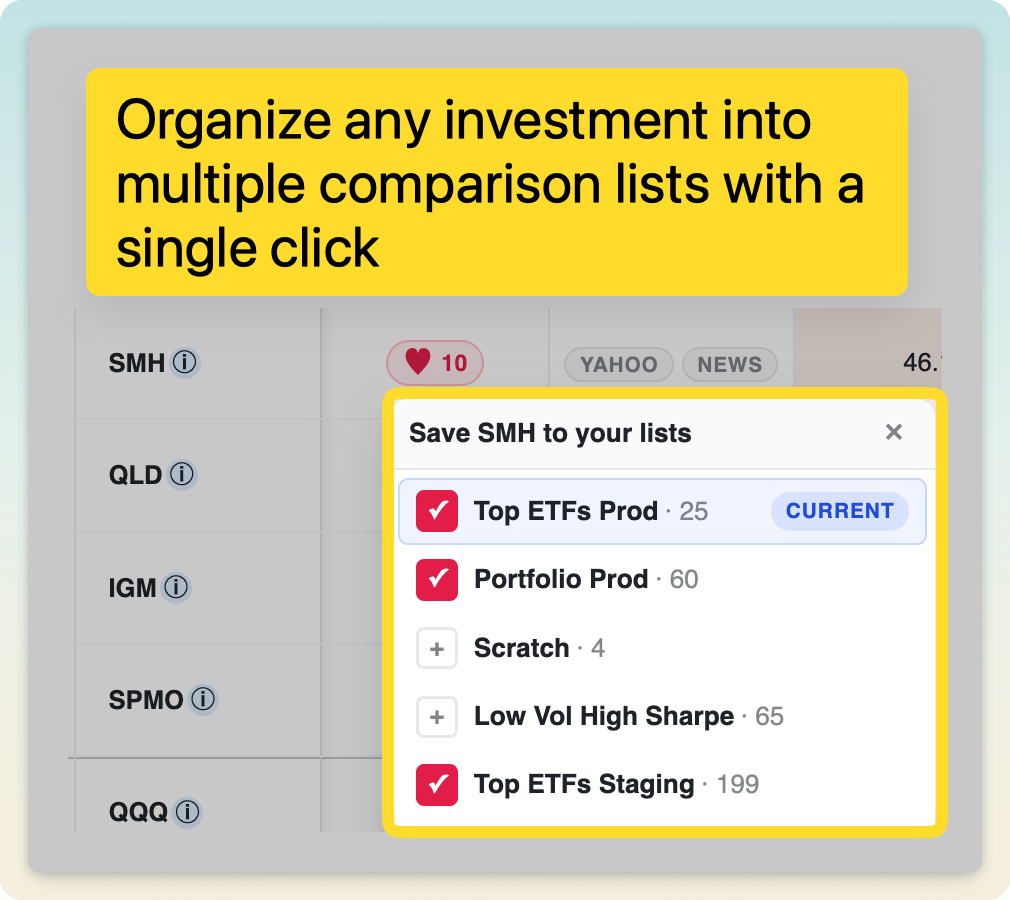
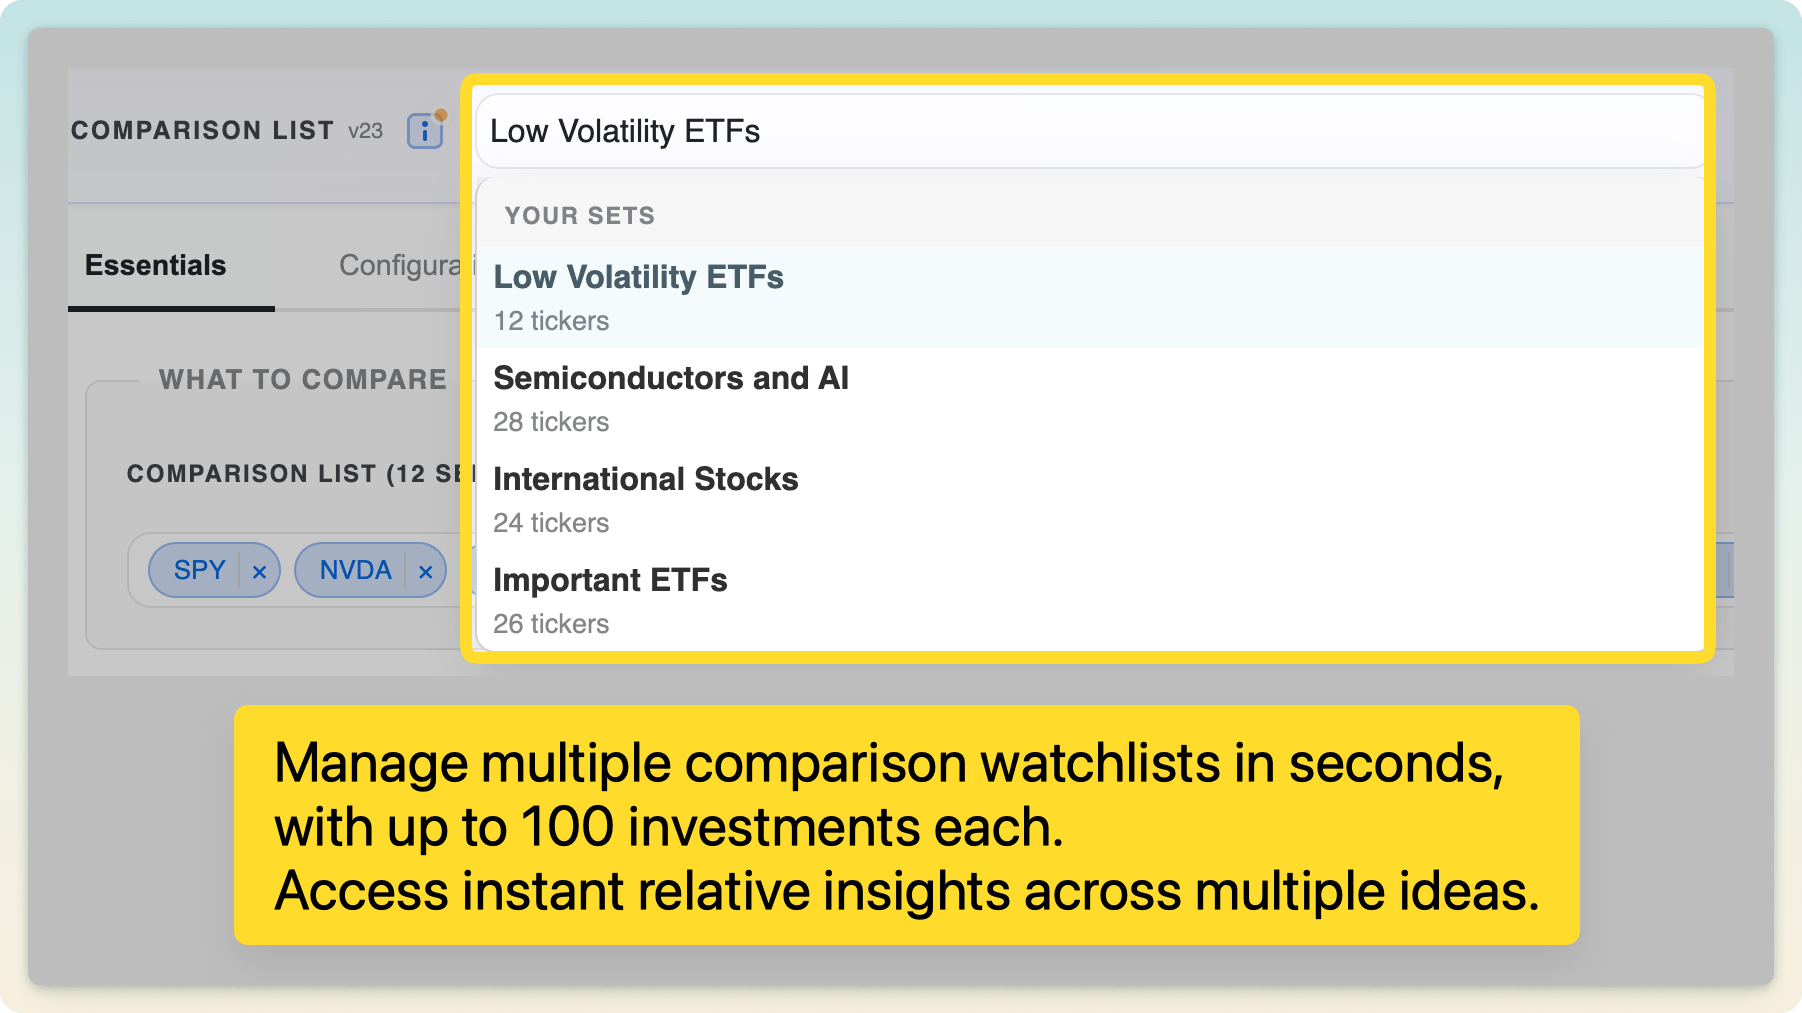
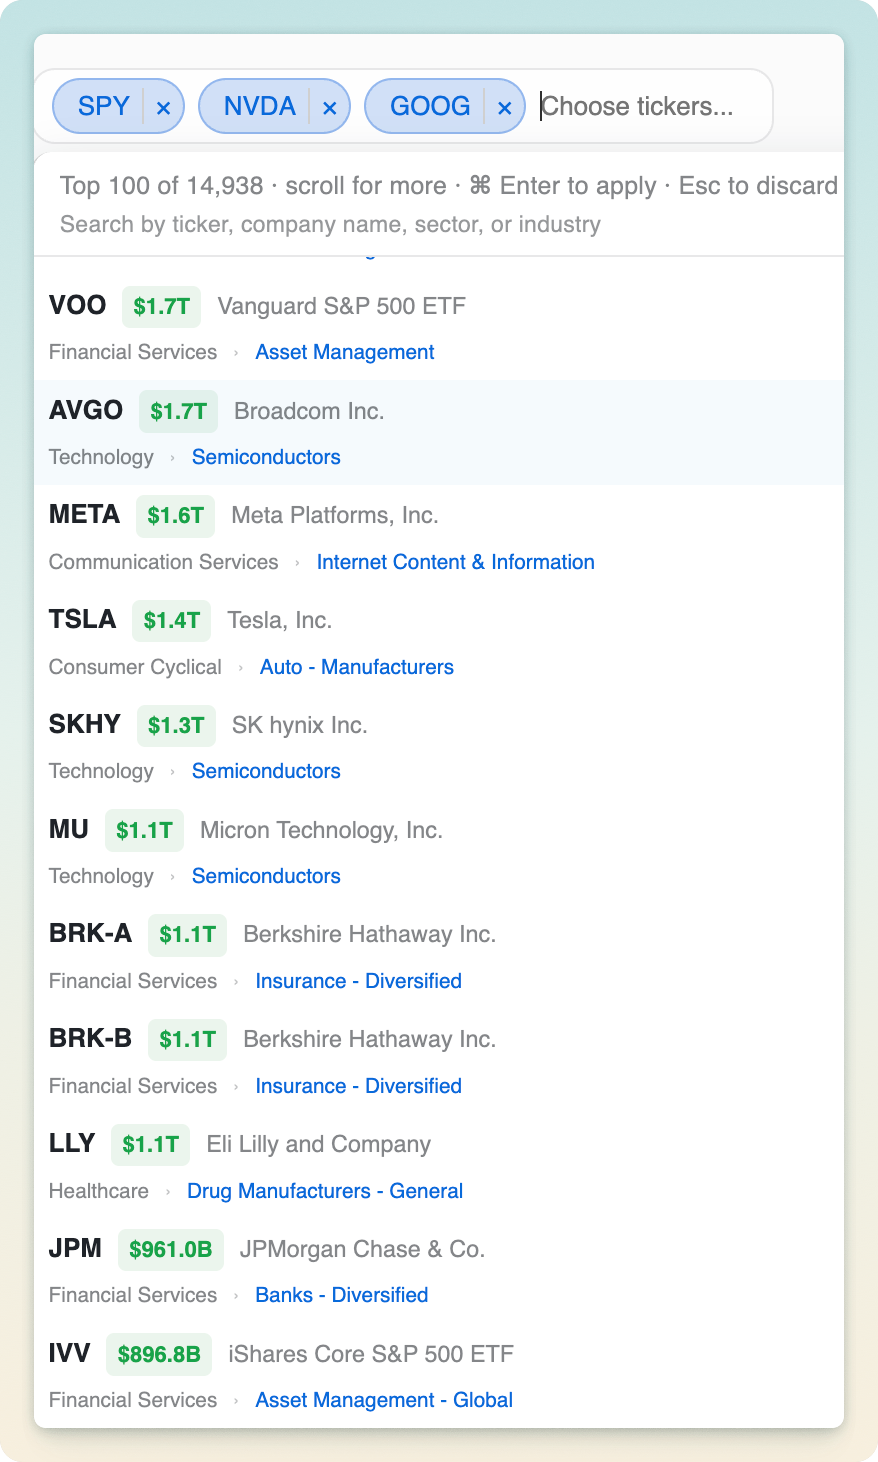
Add or remove tickers from any of your watchlists with a quick picker, right from the table. Build and refine multiple comparison lists without breaking your flow.
16
Comparison metrics to any benchmark, with a Beat Score
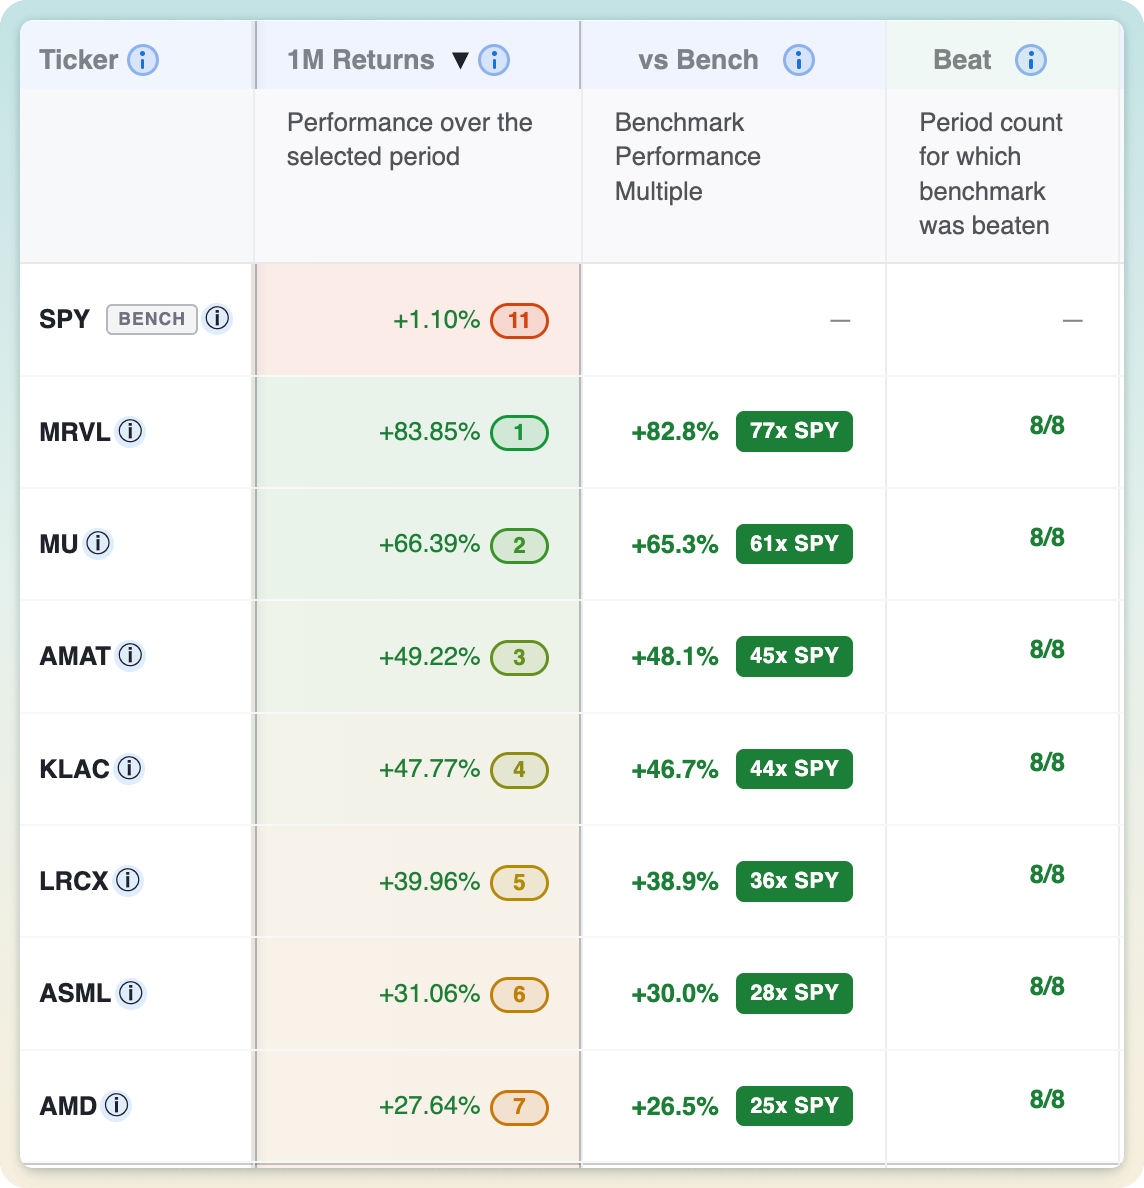
Set any benchmark (SPY by default) and see each ticker's outperformance against it, plus a Beat Score counting how many of your selected periods it actually beat the benchmark on. It instantly separates genuine market-beaters from closet trackers.
17
Links to Yahoo and Google
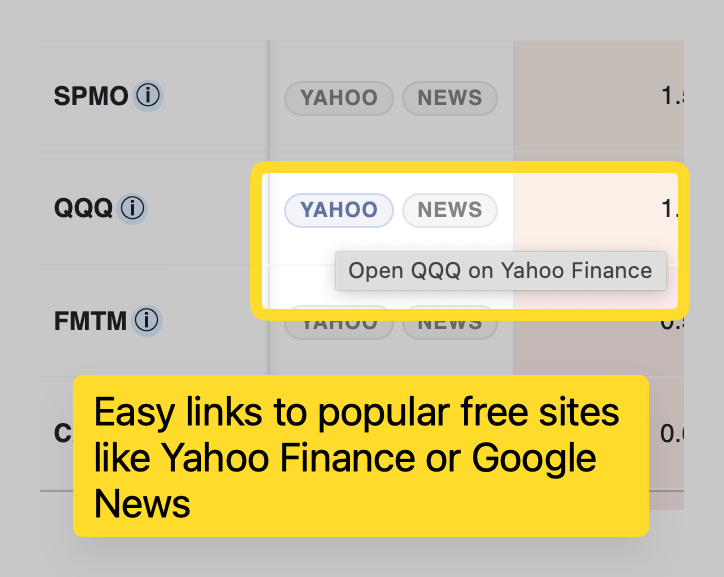
One-click shortcuts on every row jump straight to Yahoo Finance and Google for deeper research. Go from spotting an interesting ticker to reading up on it without hunting for the symbol.